Navigation:
EMS Outputs > Viewing Sensor Data > Graphical Data >> Add Calculated Series
Add Calculated Series

Contents
| Note: | The Add Calculated Series functionality is only available from EMS Version 1.0.9 onwards. |
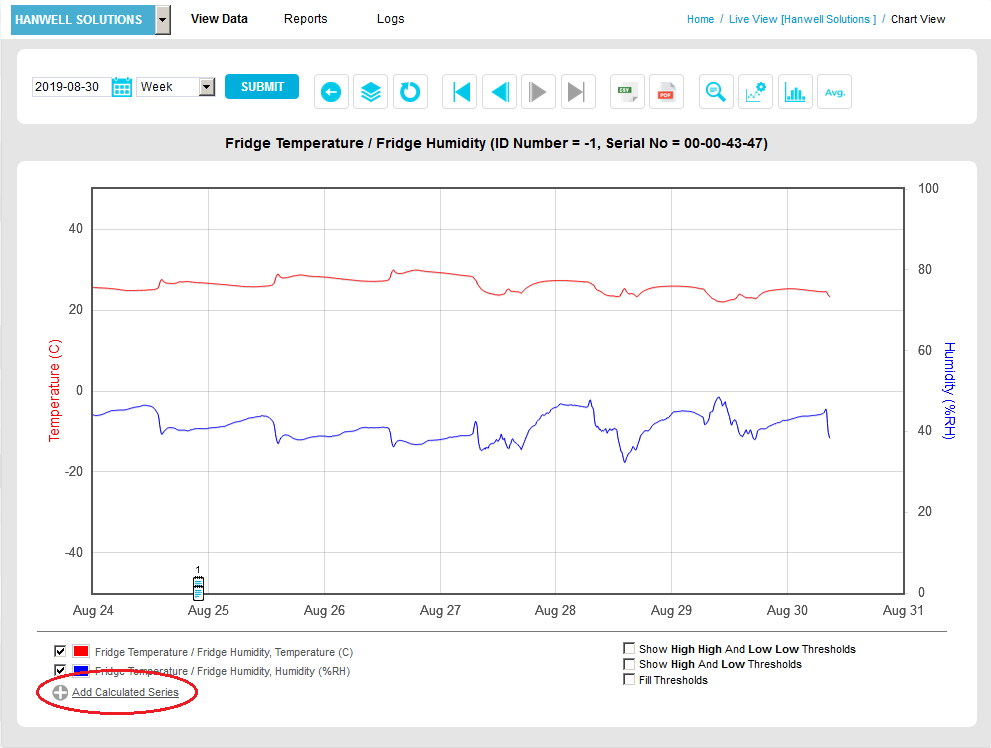
When the inputs from two Sensor/Transmitter's channels can be used to calculate a Series/Plot of values of a third, derived, parameter (a Calculated Series), the Add Calculated Series link will be displayed on relevant charts. See Figure 1166 below.
•For example, values for Temperature and Relative Humidity could be used to calculate values for the Dew Point Margin Margin.
Figure 1166
•Clicking on the Add Calculated Series link displays the Add Calculated Series window. See Figure 1167 below:
Figure 1167
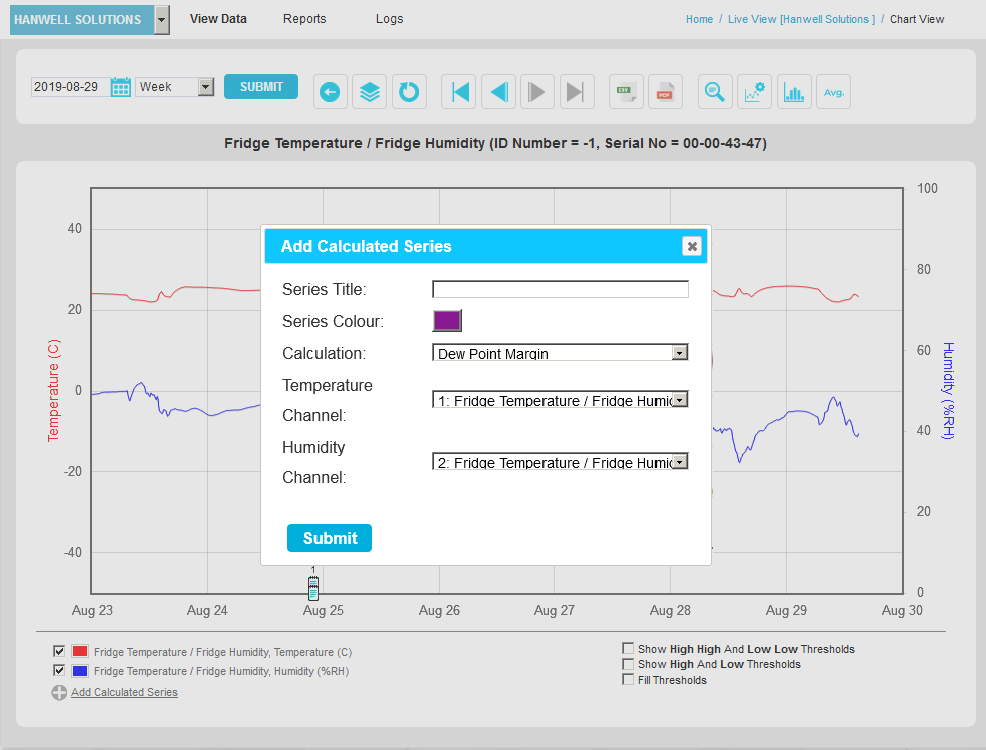
The Add Calculated Series window displays fields for:
•Series Title:
Add a name for the specific Series being calculated.
•Calculation:
From the drop-down list, select an available Series to be calculated from the data/values displayed on the selected graph.
•Series Colour:color
Allows the colourcolorof the Calculated Series's plot line on the selected graph to be defined as follows:
i.Click on the colouredcoloredsquare adjacent to the Series Colour:colorentry.
•The Color window is displayed. See Figure 1168 below:
Figure 1168
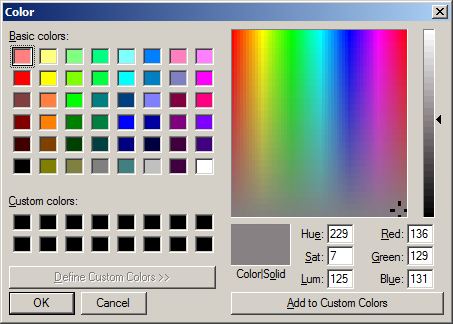
ii.Either:
Select a previously defined colour.color
Or:
Define a new colourcolorusing the Add to Custom Colourscolorsfunction.
iii.Click on OK.
•Drop-down lists, appropriate to the selected Sensor, from which you can select the Channels that provide the data used to calculate the derived Series.