
Contents
A Line graph can be zoomed in on by using the mouse.
Zooming in on a Section of a Line Graph
1.Place the mouse cursor at the point you want to zoom in on.
2.Click and hold the left mouse button.
3.Move the mouse to highlight the section of the graph to zoom in on. See Figure 1201 below:
Figure 1201
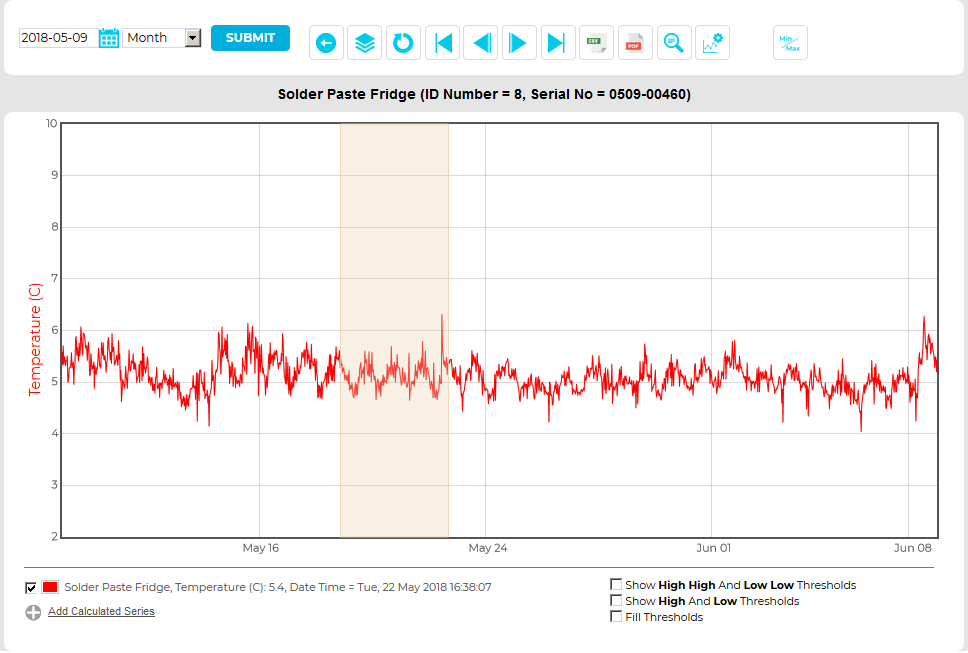
4.When the area required has been highlighted, release the left mouse button.
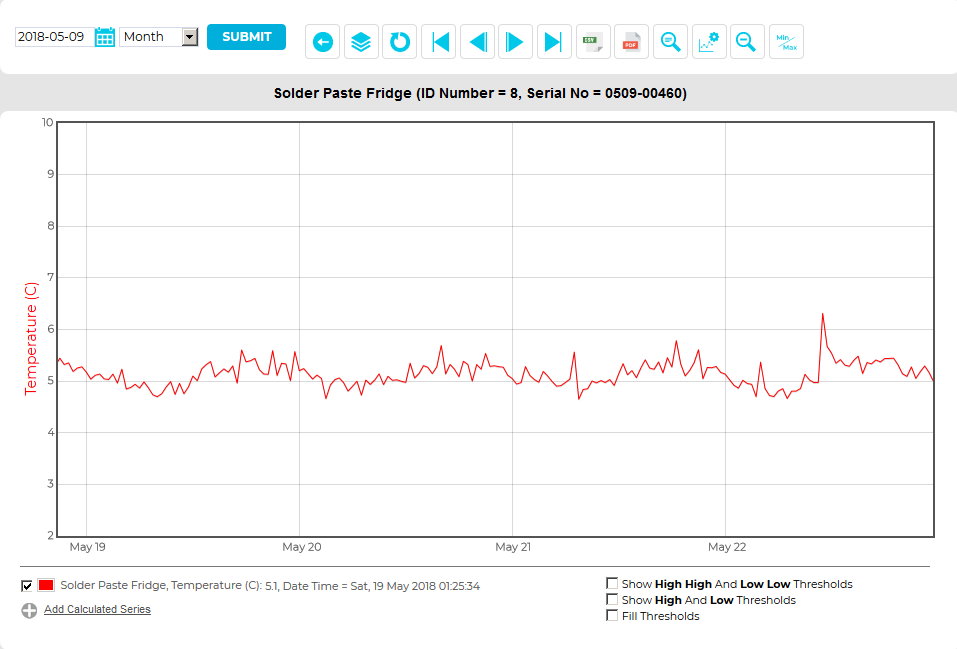
•The graph will be re-drawn, zoomed into the area selected. See Figure 1202 below:
Figure 1202
•The displayed graph can be zoomed in on again, repeatedly.
Once the graph has been zoomed once, the Zoom Out button will be displayed in the Chart View for Line charts window. See Figure 1203 below:
Figure 1203

•Clicking on the Zoom Out button zooms the graph out i.e. takes you back one 'Zoom In' step.
•To go back to no Zoom in one step you can select Reset, though this will undo any other changes carried out to the graph as well.
•Once the graph has been returned to an un-zoomed view, the Zoom Out button will disappear. See Figure 1204 below:
Figure 1204
