
Contents
•Displaying an Individual Sensor/Transmitter's Data as a Graph
•Displaying all of a Zone's Sensor/Transmitters Data as a Graph
Displaying an Individual Sensor/Transmitter's Data as a Graph
1.Check the SITES radio button at the top of the Home page. See Figure 1115 below:
Figure 1115
![]()
2.Either:
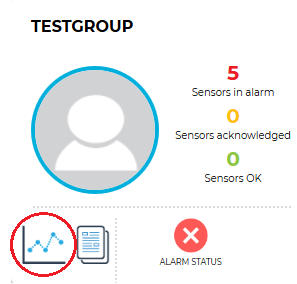
From the Graphical View, click on the View live data icon in the required Site's field . See Figure 1116 below:
Figure 1116
Or:
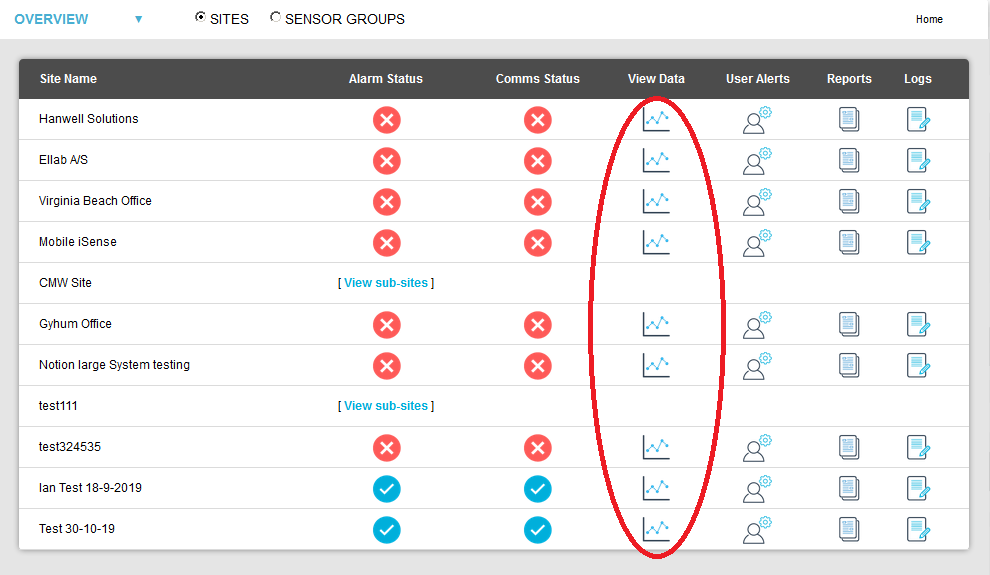
From the Table View, click on the Graph icon adjacent to the required Site in the View Data column. See Figure 1117 below:
Figure 1117
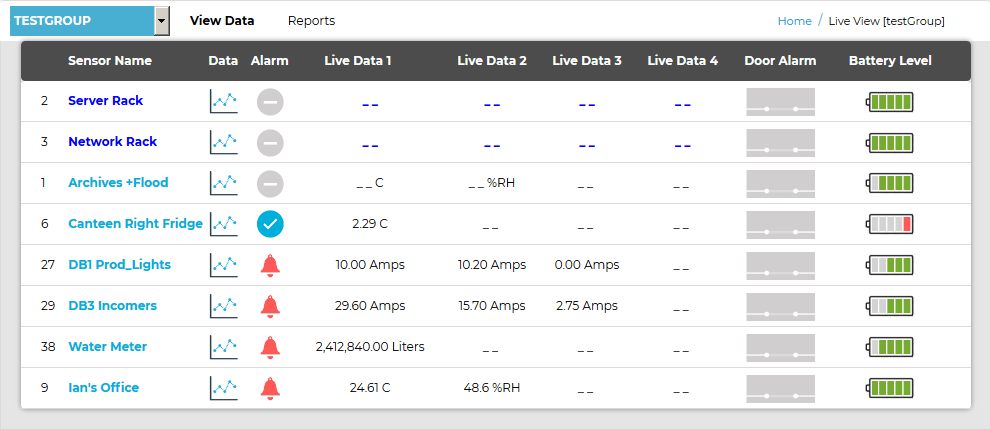
•In both cases, a Live View window for the selected Site is displayed, showing the Sensors associated with the first Zone listed. See Figure 1118 below:
Figure 1118
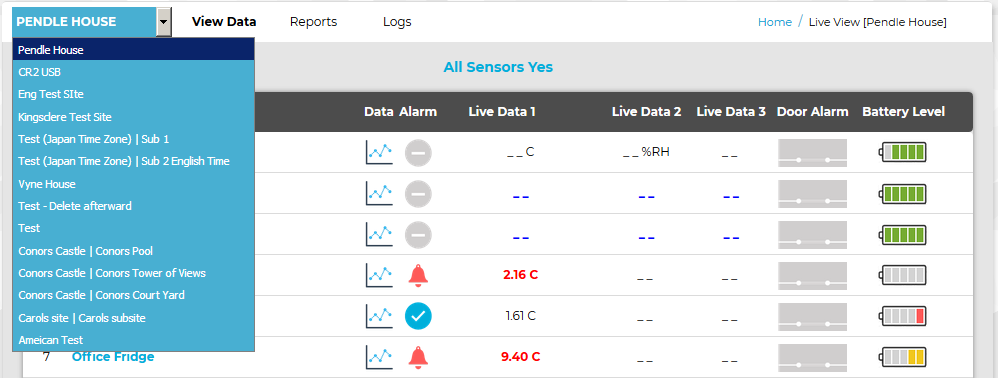
| Note: | You can display another Site's Sensors in the Live View window by selecting the required Site from the drop-down list at the top left of the window. See Figure 1119 below: |
➢ To select another Zone, click here.
Figure 1119
3.In the Live View [Site Name] window, select Live View from the View Data menu. See Figure 1120 below:
Figure 1120
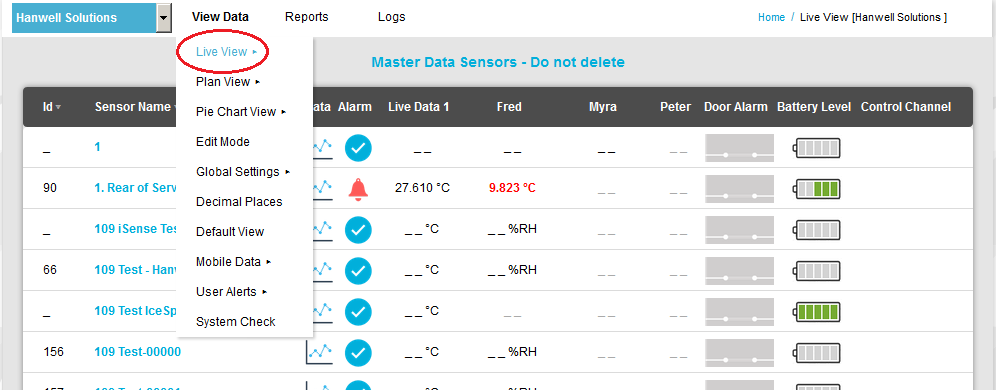
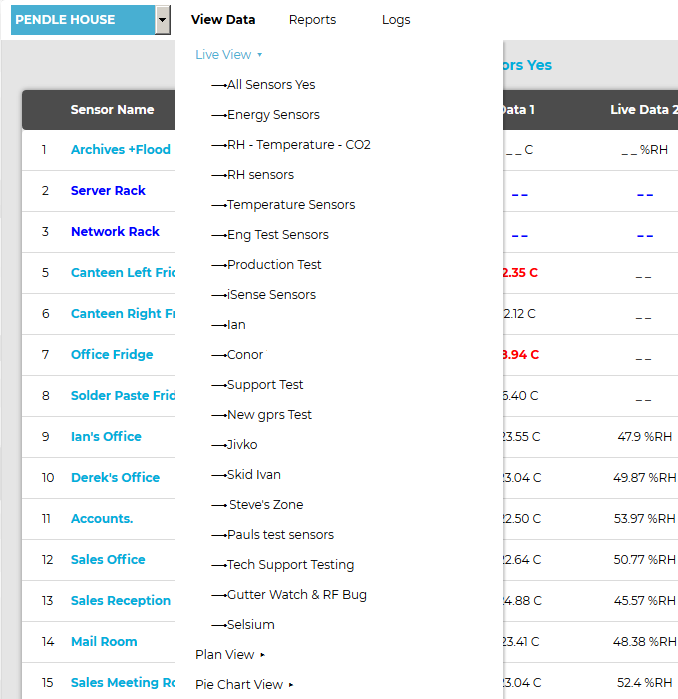
•The Live View entry in the drop-down menu is expanded to display a list of all Zones associated with the selected Site.
| Note: | By default, the Live View window displays a list of the Sensors for the Zone at the top of the drop-down list. |
See Figure 1121 below:
Figure 1121
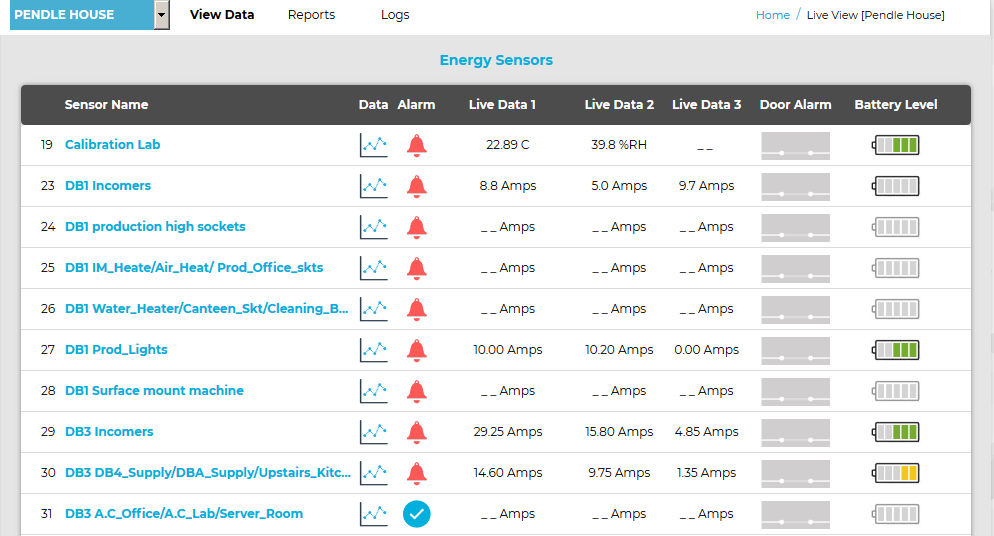
4.Click on the required Zone's name from the displayed list.
•A Live View [Site name] window is displayed, showing live data from the Sensors associated with the selected Zone. See Figure 1122 below:
Figure 1122
5.Click on the View live data icon ![]() on the required Sensor's row.
on the required Sensor's row.
•The Sensor's data is displayed as a graph.
| Note: | Depending on the amount of data to be uploaded to the Chart, the following 'Loading' animation may be displayed. See Figure 1123 below: |
Figure 1123
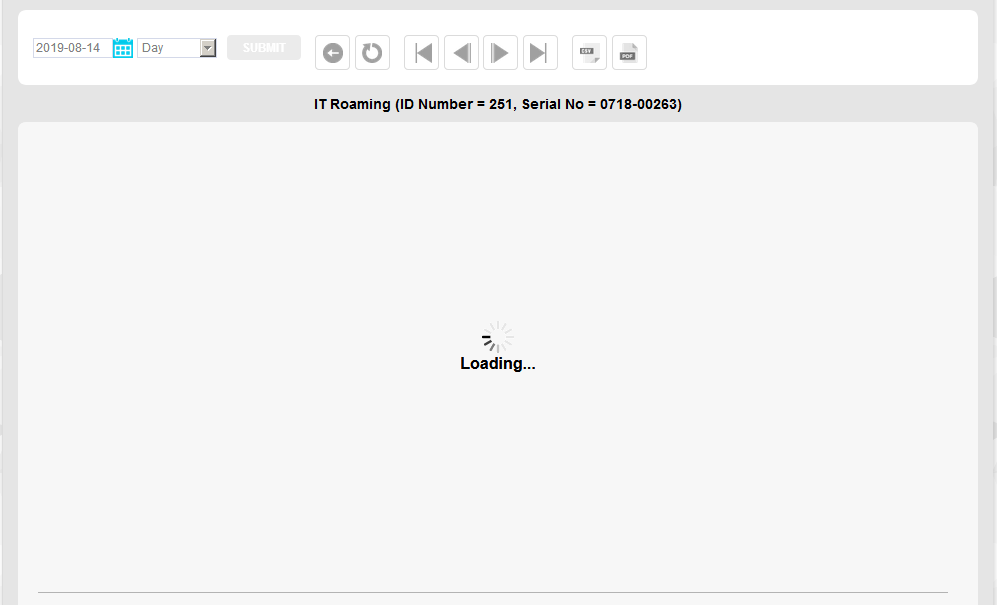
➢If an error occurs while the data is loading, an Error message will be overlaid on the chart area.
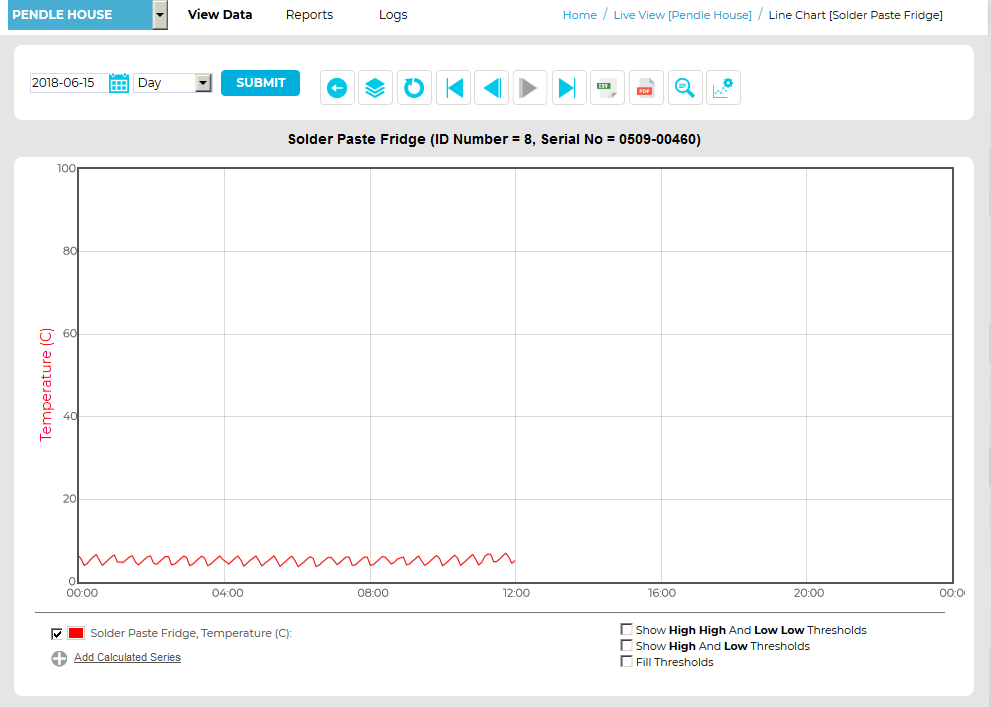
•By default, the majority of Sensors will display Live Data as a Line Graph in the Chart View window, as shown in Figure 1124 below.
Figure 1124
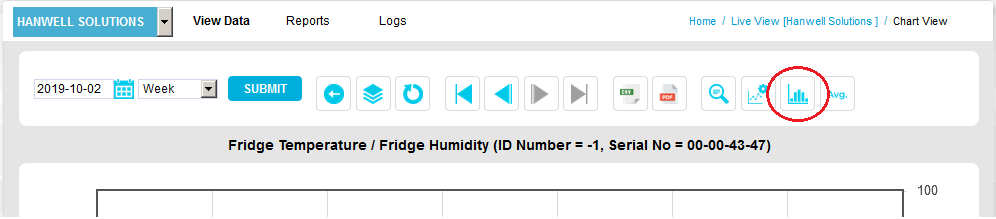
➢To switch the graph to a Bar Chart, click on the Bar Chart icon at the top of the Chart View window. See Figure 1125 below:
Figure 1125
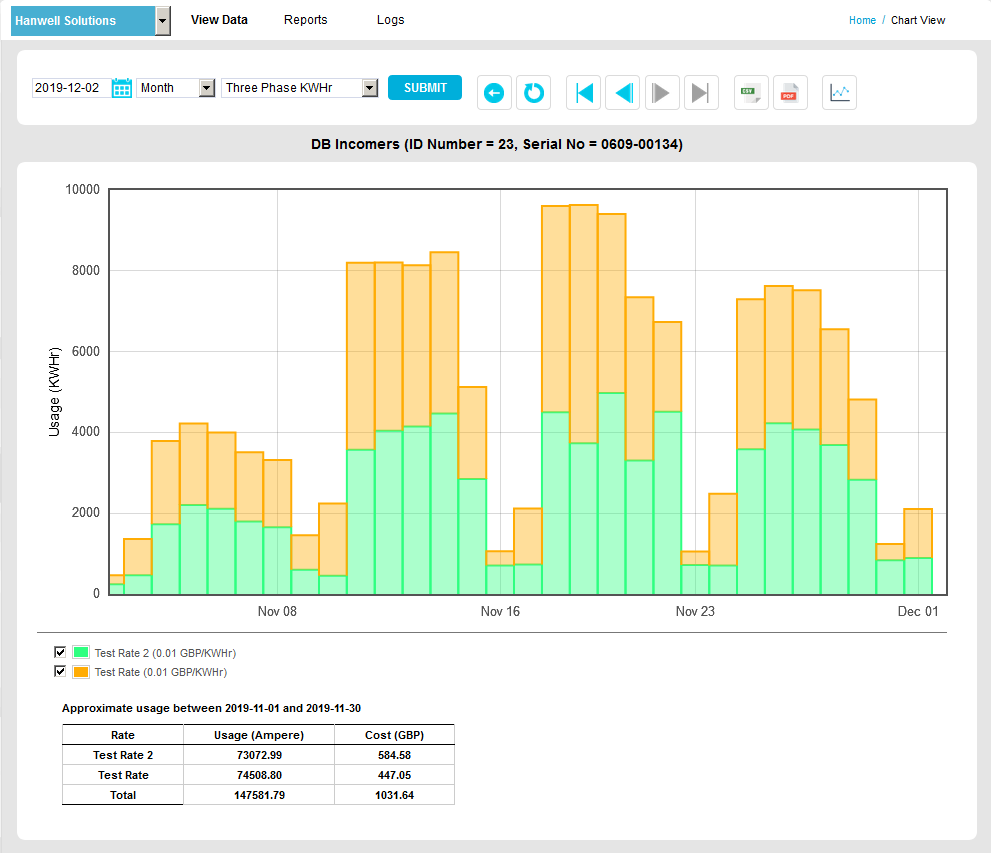
| Note: | By default, a Current or Pulse Count Sensor's data will be displayed as a Utilities Bar Chart in the Chart View window, as shown in Figure 1126 below: |
Figure 1126
Displaying all of a Zone's Sensor/Transmitters Data as a Graph
1.Check the SITES radio button at the top of the Home page. See Figure 1127 below:
Figure 1127
![]()
2.Either:
From the Graphical View, click on the View live data icon in the required Site's field . See Figure 1128 below:
Figure 1128
Or:
From the Table View, click on the Graph icon adjacent to the required Site in the View Data column. See Figure 1129 below:
Figure 1129
•In both cases, a Live View window for the selected Site is displayed, showing the Sensors associated with the first Zone listed. See Figure 1130 below:
Figure 1130
➢ To select another Zone, click here.
| Note: | You can display another Site's Sensors in the Live View window by selecting the required Site from the drop-down list at the top left of the window. See Figure 1131 below: |
Figure 1131
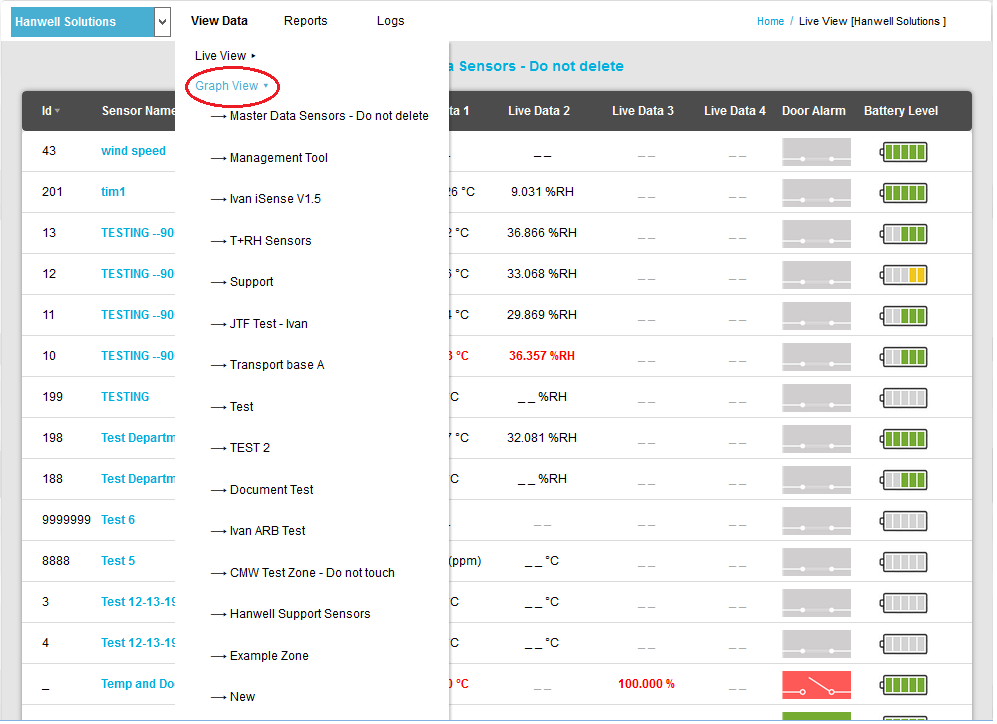
4.From the View Data drop down main menu entry, click on the Graph View entry. See Figure 1132 below:
Figure 1132
•A drop-down list of the Site's Zones is displayed.
5.Select the required Zone from the drop-down list.
•A graph is displayed, showing data from all of the Zones Sensors. See Figure 1133 below:
Figure 1133
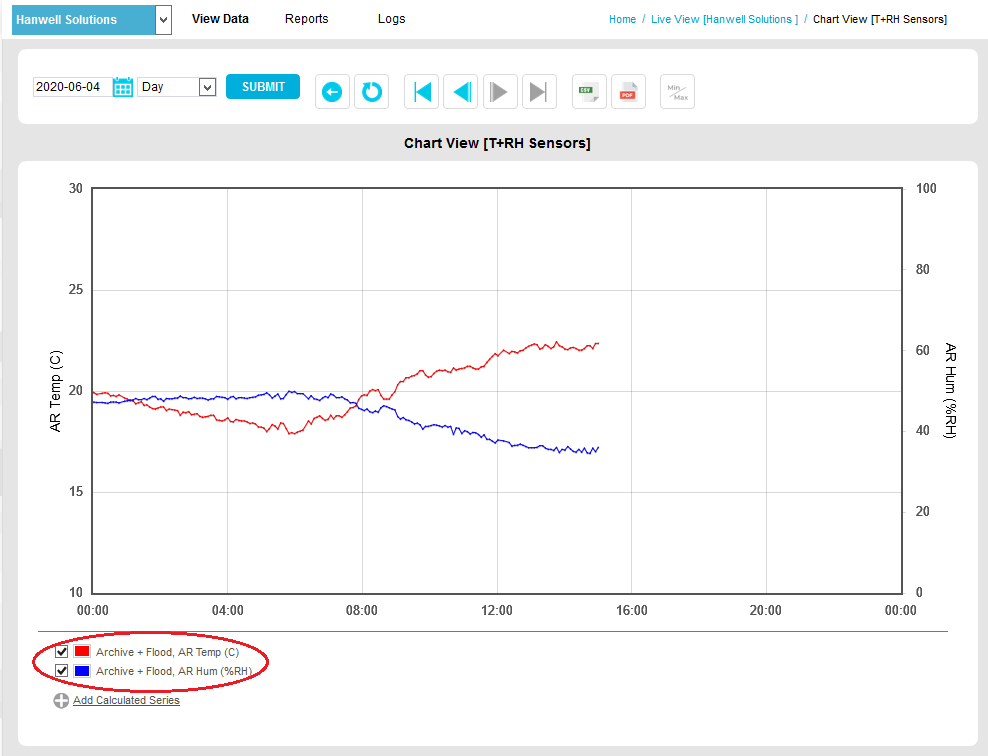
•A key is displayed at the bottom left of the window showing each represented Sensor's name and graph plot colour. See Figure 1133 above.
The following Graph Functionality, related to the graphical display of Sensor/Transmitter data, is available from the Graph window:
•Print Graph
| Note: | Whilst much of the Graph Functionality is common to both graph types, please be aware that the exact functionality available depends on the selected graph type, the interval selected and the type of Sensor. |