Summary Data is available for most Sensor types.
Displaying Summary Data for the Selected Time Interval
Click on the View Summary button in the top menu bar of the Chart View for Line charts window. See Figure 1194 below:
Figure 1194

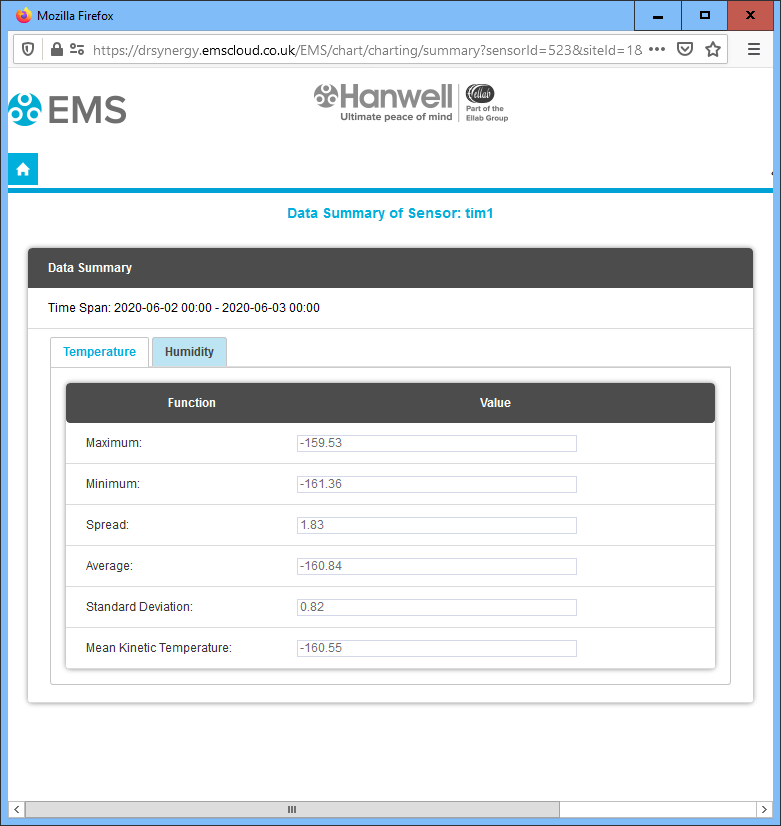
•The Data Summary window is displayed in a new browser window, showing Summary Data for each parameter for the selected Time Interval.
➢Each Channel's data is shown on a separate tab. See Figure 1195 below:
Figure 1195

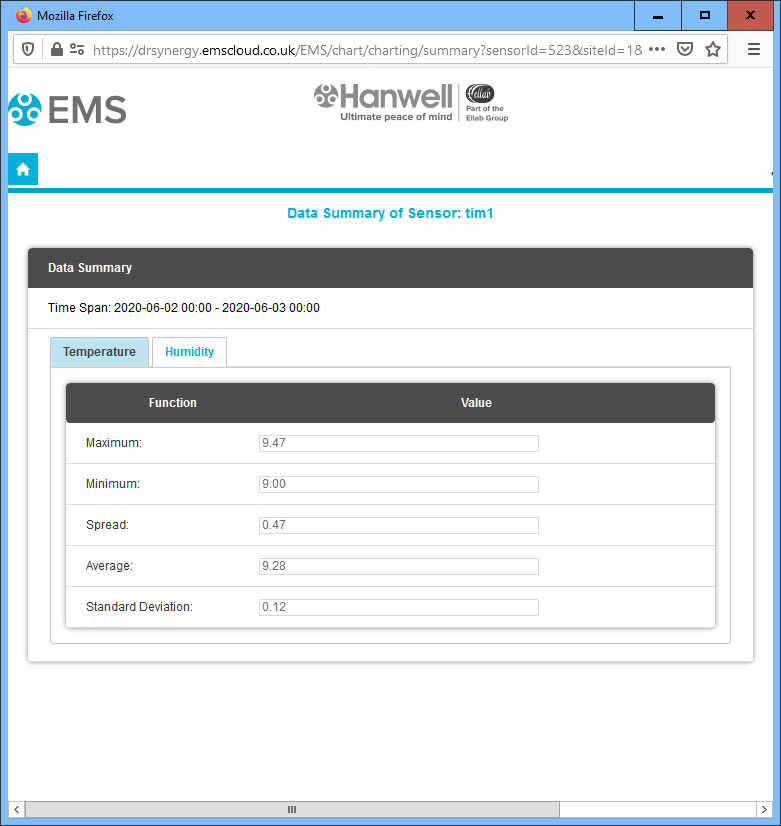
•In this example, clicking the Humidity tab will display Summary Data for the Humidity parameter. See Figure 1196 below:
Figure 1196

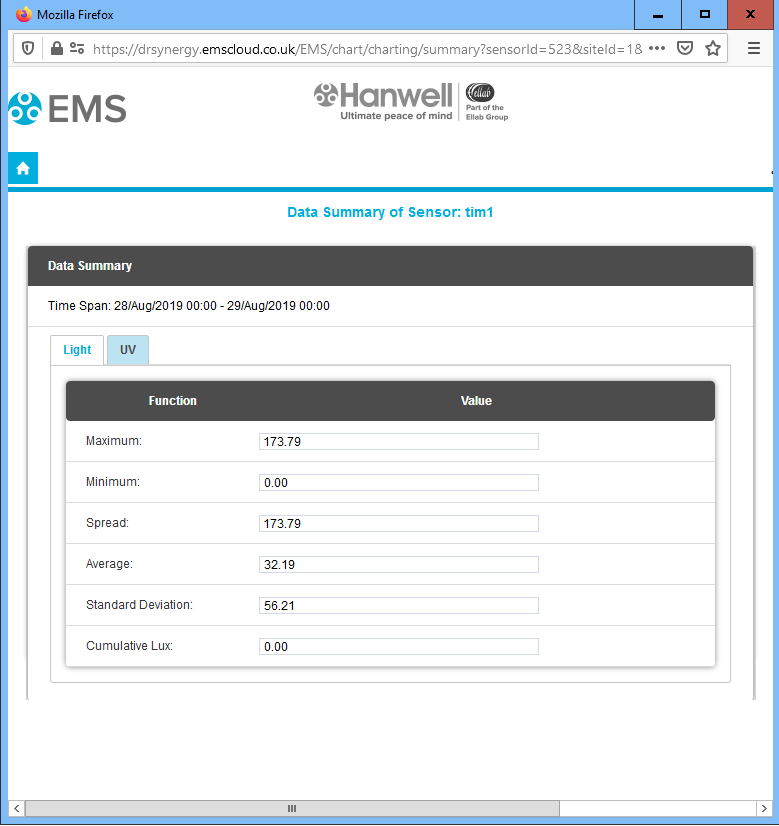
•As another example, a Data Summary window for a Cumulative Lux (light) Sensor could be displayed. See Figure 1197 below:
Lux LUX is a measure of the brightness of the incident light but measured in such a way as to be comparable with the subjective opinion formed by the human eye. In practise this means choosing a detector that has a similar spectral response to our own eye. Hanwell Instruments use a photocell which gives an accuracy of approximately 1% FSD. •The Lux is the SI Unit of Illuminance, measuring Luminous Flux per unit area. •One Lux is defined as a brightness corresponding to one Lumen per square meter. Where: •Illuminance is a measure of how much Luminous Flux is spread over a given area; that is, a measure of the intensity of illumination on a surface •Luminous Flux (measured in Lumens) is a measure of the total ‘amount’ of visible light present. And: •The Lumen is the SI Unit of Luminous Flux, a measure of the total quantity of visible light emitted by a source per unit of time.
Therefore, to be clear, the Lumen is a measure of the total quantity of visible light emitted by a source weighted so it is as would be seen by the standard human eye. Cumulative Lux Damage from light is cumulative in its effect; that is, the longer you leave an item exposed to light, the more damage the exposure will cause. Reducing the damage done by light means considering both intensity of the light (Lux) and the length of exposure.
•Prior to EMS Version 1.0.10 ( 2.0.3 EMS Compliant) Cumulative Lux is expressed as the sum of all Lux readings. •From EMS Version 1.0.10 (2.0.3 EMS Compliant) onwards, Cumulative Lux is expressed as Lux/Hours over the elected period. |
Figure 1197

