
Contents
| Note: | The Frequency Graph functionality is only available from EMS Version 1.0.9 onwards. |
•Displaying a Frequency Graph for a Selected Sensor's Data
➢Adjust Width of Graph's Bars/Bands
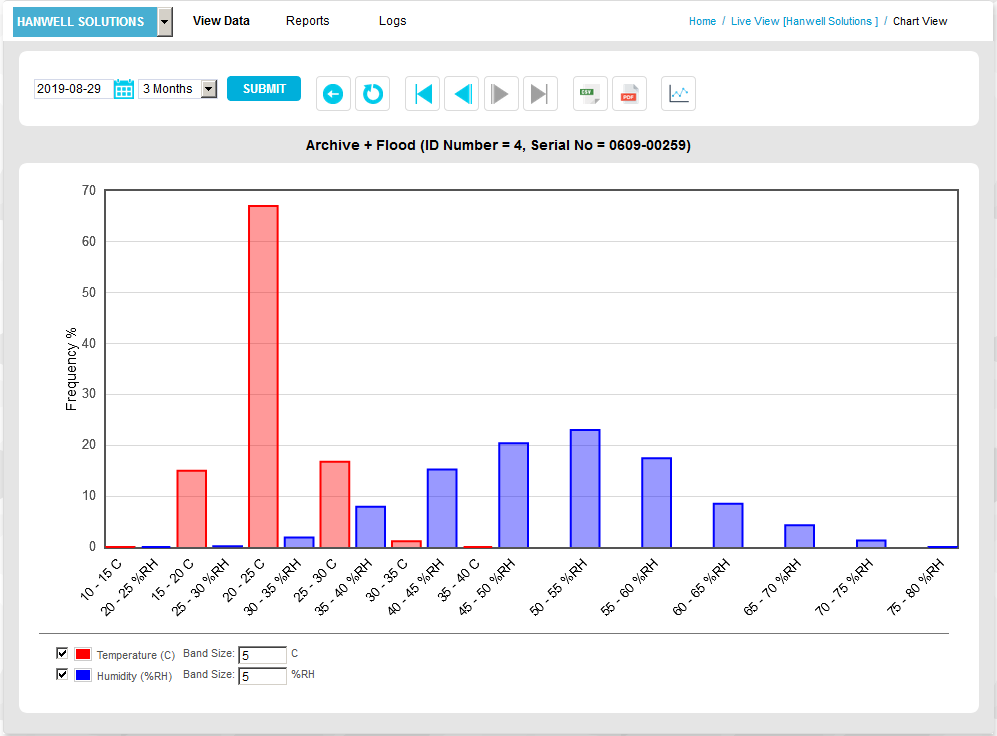
The Frequency Graph/Bar Chart displays the frequency (as a percentage) with which User defined ranges of data occur, for each of a Transmitter/Sensor's channels. See Figure 1174 below:
Figure 1174
Displaying a Frequency Graph for a Selected Sensor's Data
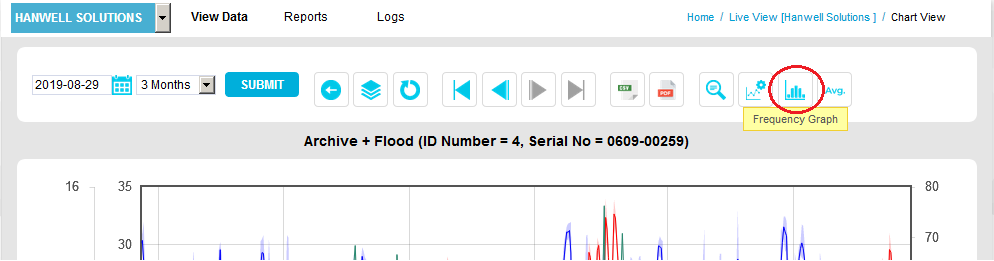
In the displayed Chart View window, click on the Frequency Graph button. See Figure 1175 below:
Figure 1175
•A Frequency Graph is displayed, with a specific colourcolorof bar representing each data channel. See Figure 1176 below:
Figure 1176
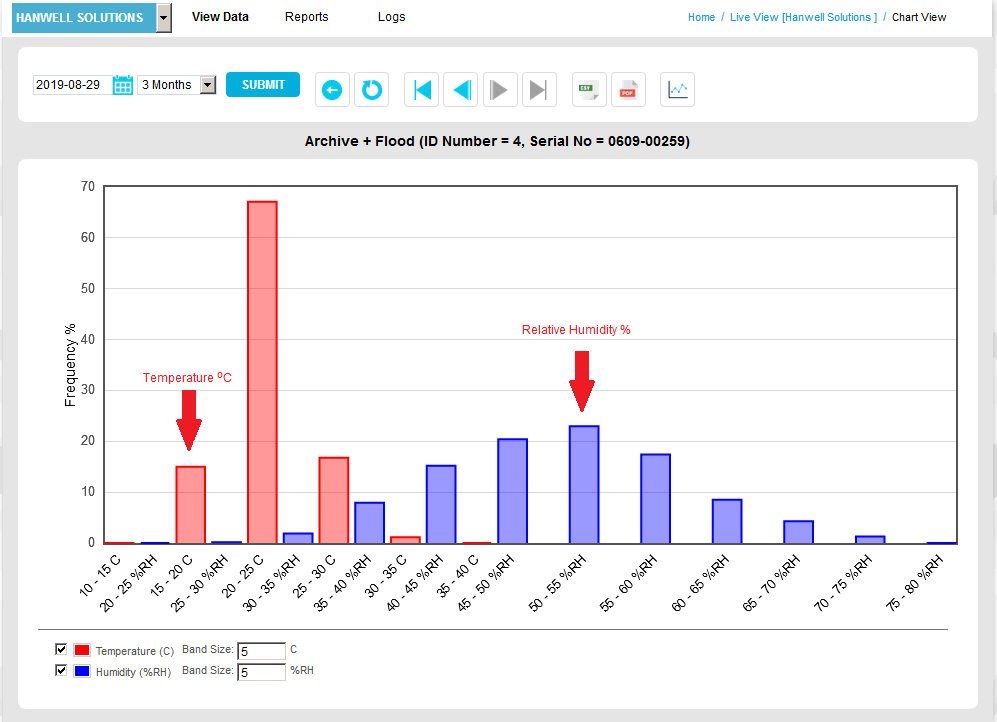
Each Channel represented on the Frequency Graph is represented in the key on the bottom left of the Graph; by default, all of the selected Sensor's Channels are shown.
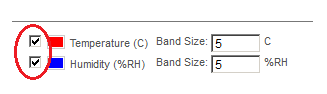
1.Tick/Untick the box adjacent to the relevant Channel to, respectively, display it in or remove it from the Graph. See Figure 1177 below:
Figure 1177
2.Click on the displayed Save display preferences link. See Figure 1178 below:
Figure 1178
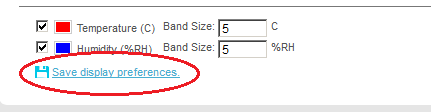
| Note: | At least one Channel must be displayed on the Graph. |
Adjust Width of Graph's Bars/Bands
The width of the bars/bands representing each Channel's data can be adjusted by entering a value or values, into the Band Size: boxes, for the range of Units each Bar/Band represents. See Figure 1179 below:
Figure 1179
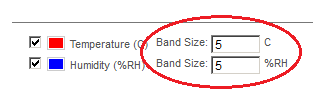
1.Enter the required values into the relevant Band Size: boxes.
2.Click on the displayed Save display preferences link. See Figure 1180 below:
Figure 1180