Navigation:
EMS Outputs > Viewing Sensor Data > Graphical Data >> Utilities Bar Chart
Utilities Bar Chart

Contents
•Changing the Units that Usage Values are Displayed in
•Selecting Channels to Display on the Utilities Bar Chart
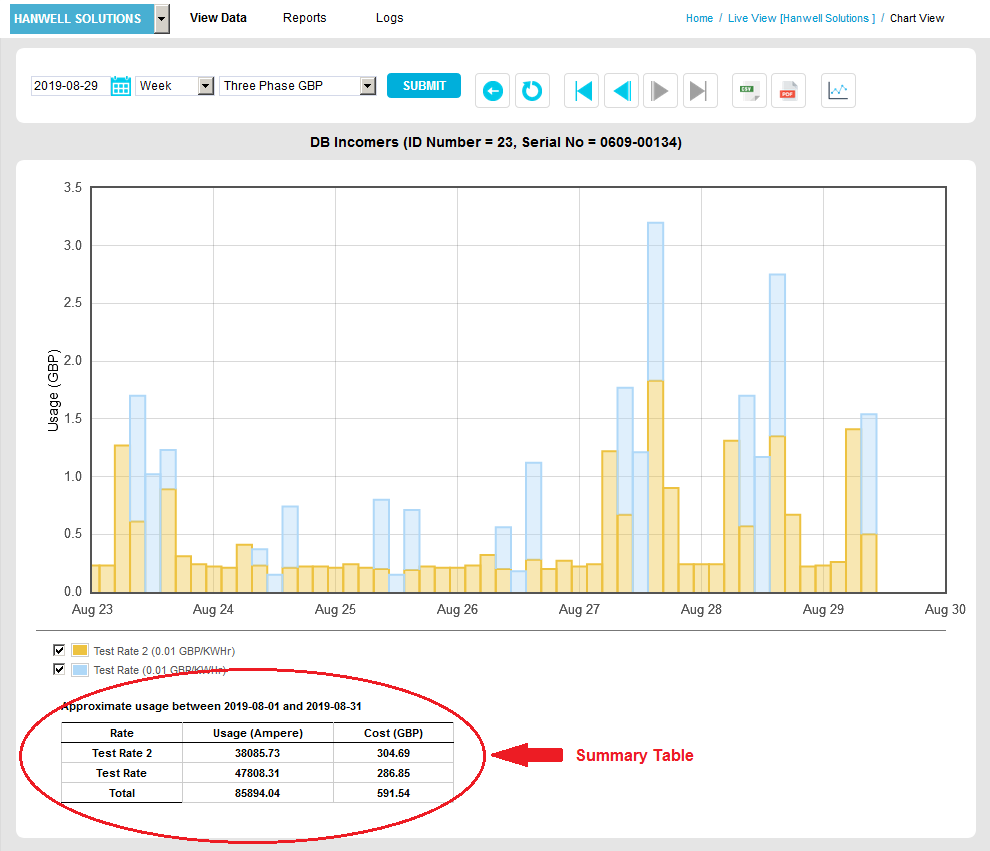
When a Current or Pulse Count Sensor is selected, a Utilities Bar Chart is displayed in the Chart View window. See Figure 1169 below.
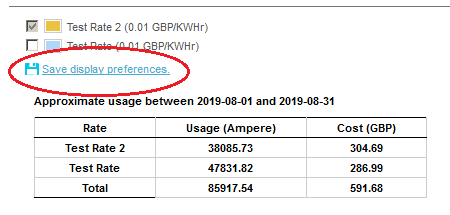
•From EMS Version 1.0.9 onwards, a Summary Table is displayed at the bottom of the Utilities Bar Chart window, showing the approximate energy/water/gas etc. usage over the graph's time period and associated charges, accrued at the selected tariff. See Figure 1169 below:
Figure 1169
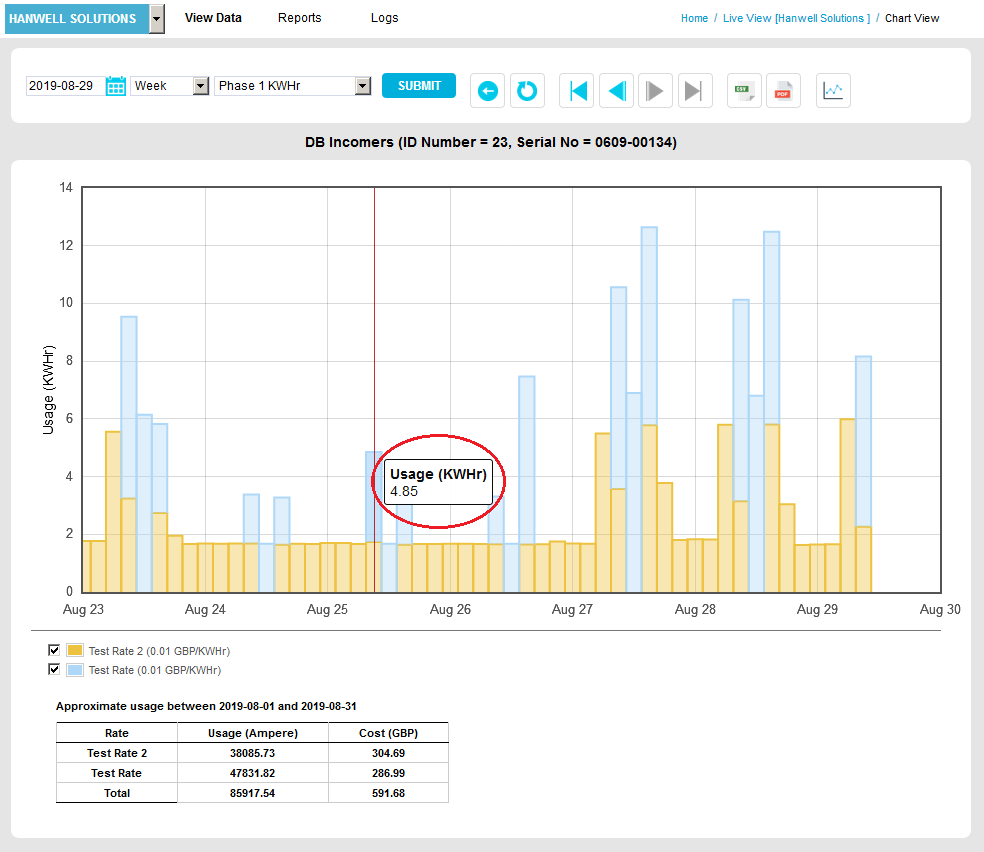
To view the Usage during a specific time period on the graph, hover the mouse pointer over the graph bar to display the Usage values in a popup window. See Figure 1170 below:
Figure 1170
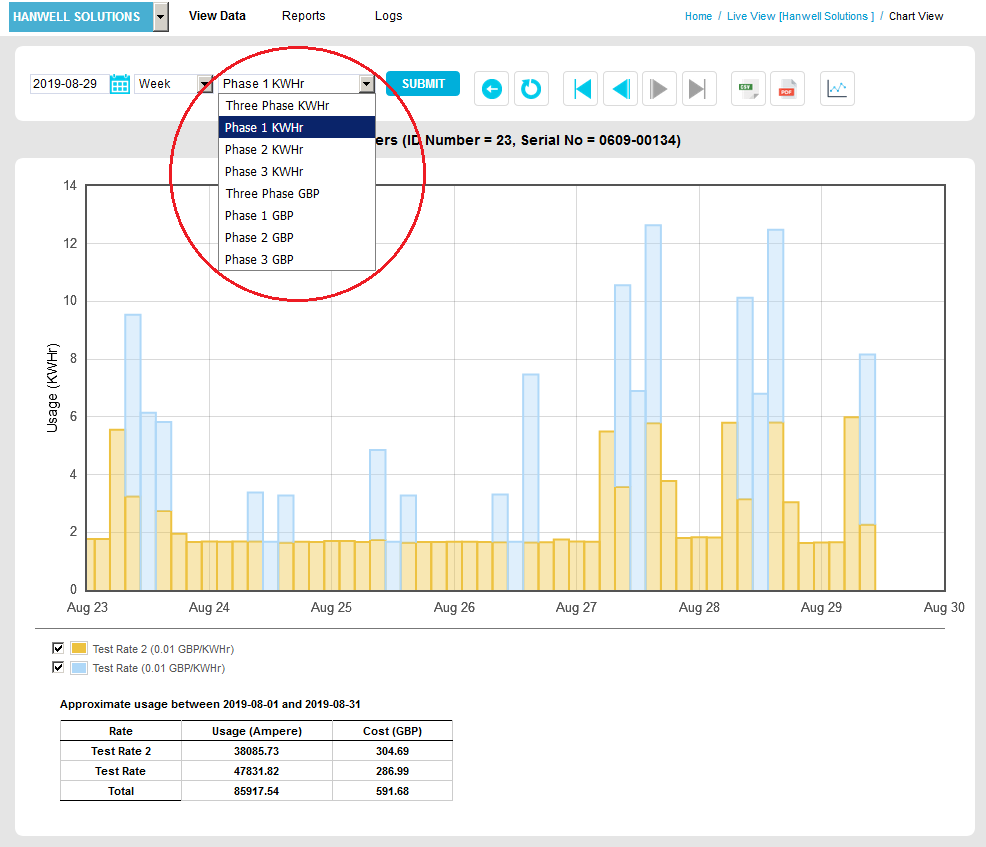
Changing the Units that Usage Values are Displayed in
1.Select the required Units from the Units drop-down list. See Figure 1171 below:
Figure 1171
2.Click on the Submit button.
•The Utilities Bar Chart's display is changed to reflect the Units selected along with the Usage values' Units in the popup windows.
Selecting Channels to Display on the Utilities Bar Chart
| Note: | It is only possible to select specific Channels to display from EMS Version 1.0.9 onwards. |
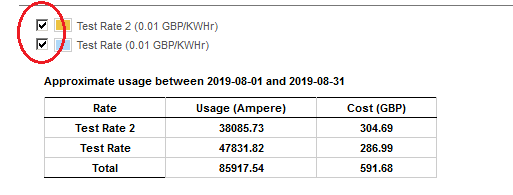
Each Channel represented on the Utilities Bar Chart is represented in the key on the bottom left of the Chart; by default, all of the selected Sensor's Channels are shown.
1.Tick/Untick the box adjacent to the relevant Channel to, respectively, display it in or remove it from the Chart. See Figure 1172 below:
Figure 1172
2.Click on the displayed Save display preferences link. See Figure 1173 below:
Figure 1173
•The Utilities Bar Chart is displayed with the selected Channels added/removed.
| Note: | At least one Channel must be displayed on the Graph. |