
Contents
Data specific to a Date and Time selected by the cursor, for the selected Sensor/transmitter, is shown at the foot of the Chart View for Line charts window.
See Figure 1193 below:
Figure 1193
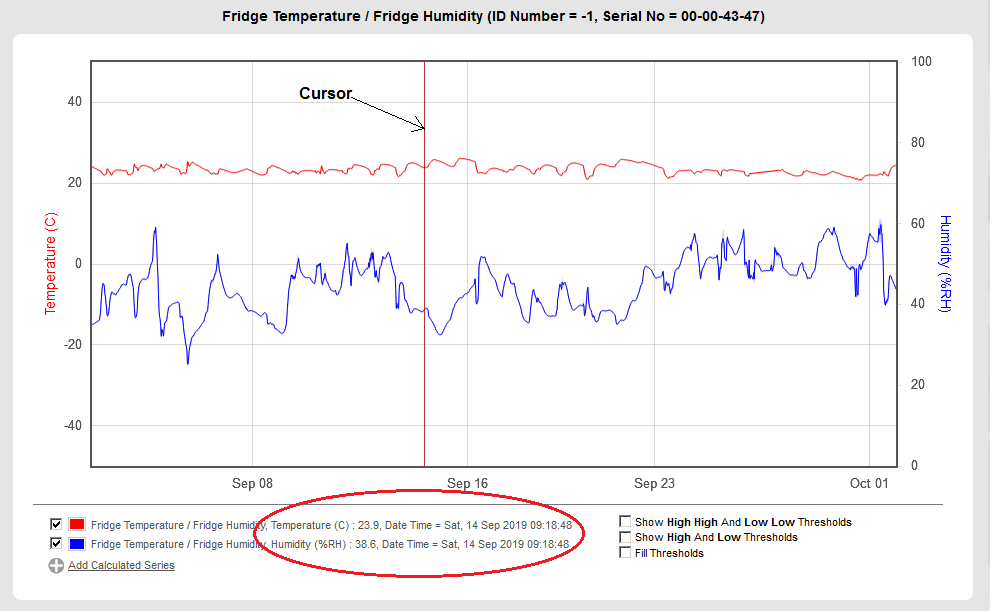
•Moving the mouse pointer/cursor changes the data displayed to reflect the changed Date/Time.