
Contents
This section will guide you through all aspects of viewing Sensor/Transmitter data.
•Viewing Sensor Data for a Site
•Viewing Sensor Data for a Sensor Group
Viewing Sensor Data for a Site
1.Check the SITES radio button at the top of the Home page. See Figure 1034 below:
Figure 1034
![]()
2.Either:
From the Graphical View, click on the View live data icon in the required Site's field. See Figure 1035 below:
Figure 1035
Or:
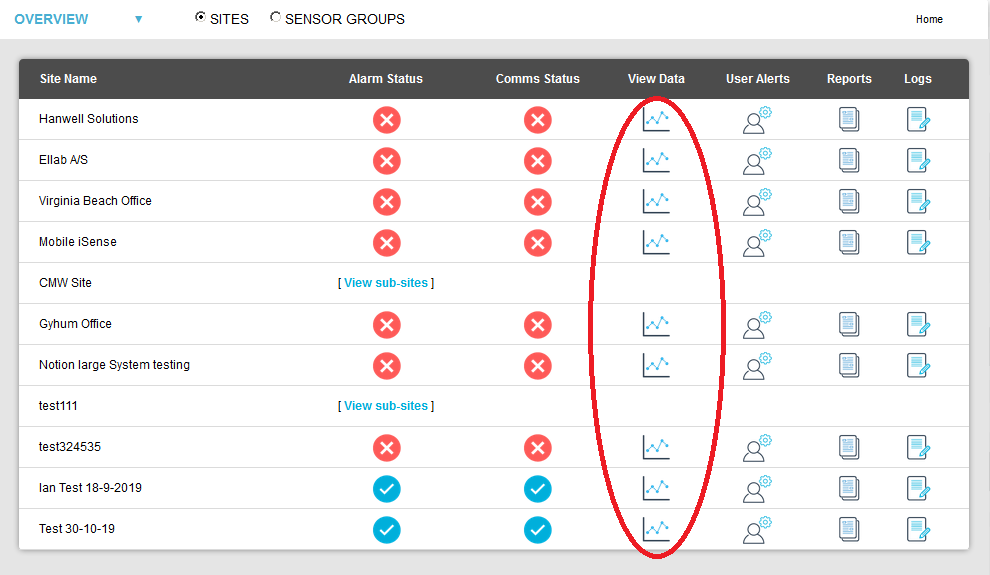
From the Table View, click on the Graph icon adjacent to the required Site in the View Data column. See Figure 1036 below:
Figure 1036
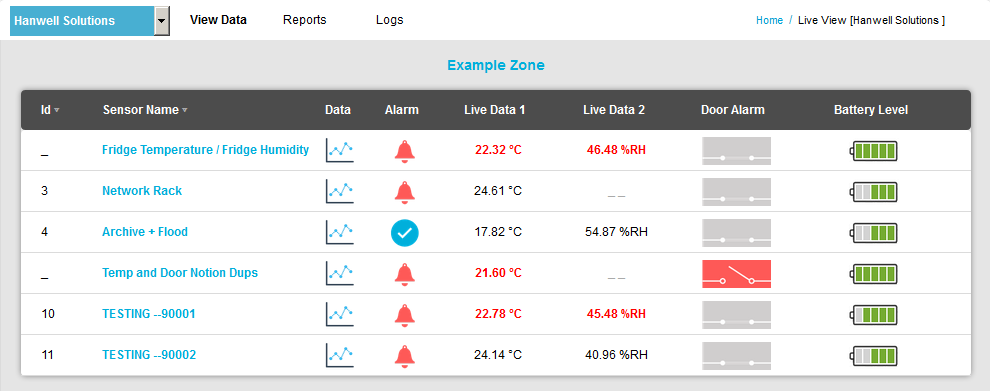
•In both cases, a Live View window for the selected Site is displayed, showing the Sensors associated with the first Zone listed. See Figure 1037 below:
Figure 1037
➢ To select another Zone, click here.
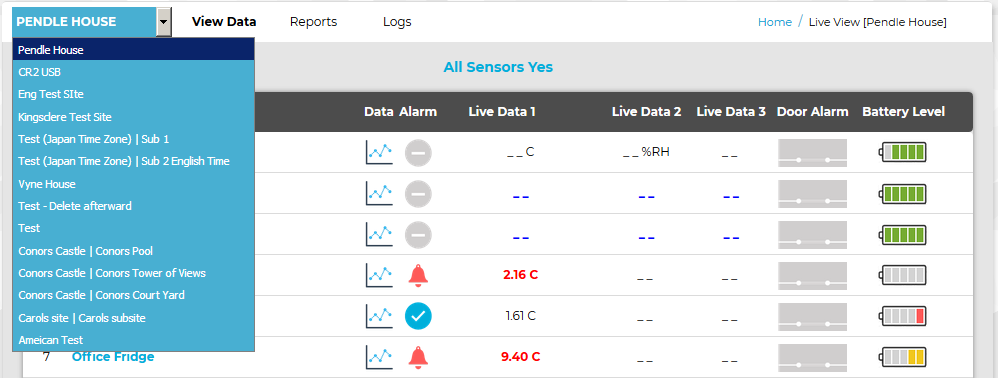
| Note: | You can display another Site's Sensors in the Live View window by selecting the required Site from the drop-down list at the top left of the window. Figure 1038 below: |
Figure 1038
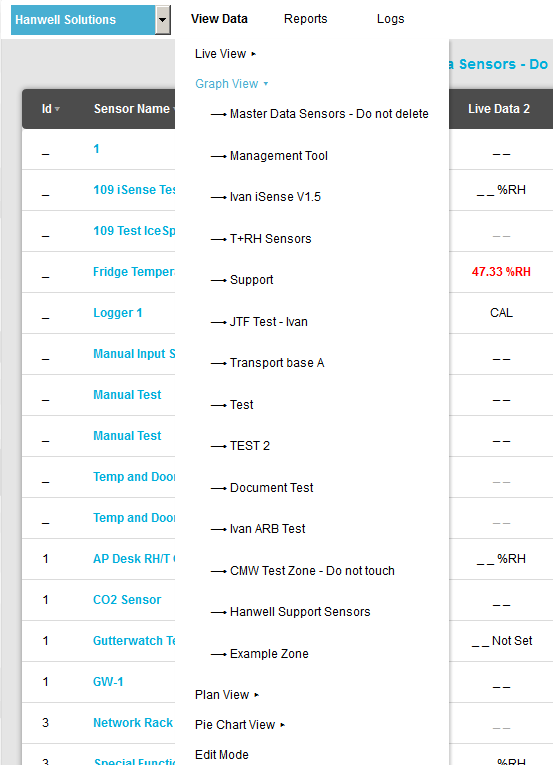
3.In the Live View window, select View Data from the top menu bar. See Figure 1039 below:
Figure 1039
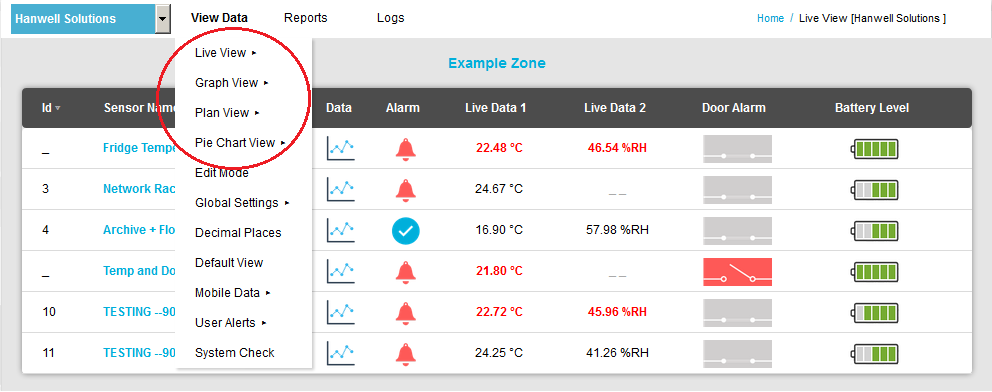
•From the drop-down menu, you have a choice of three data viewing options for the selected Site:
See Figure 1039 above
To View Live Data from a Zone's Sensors:
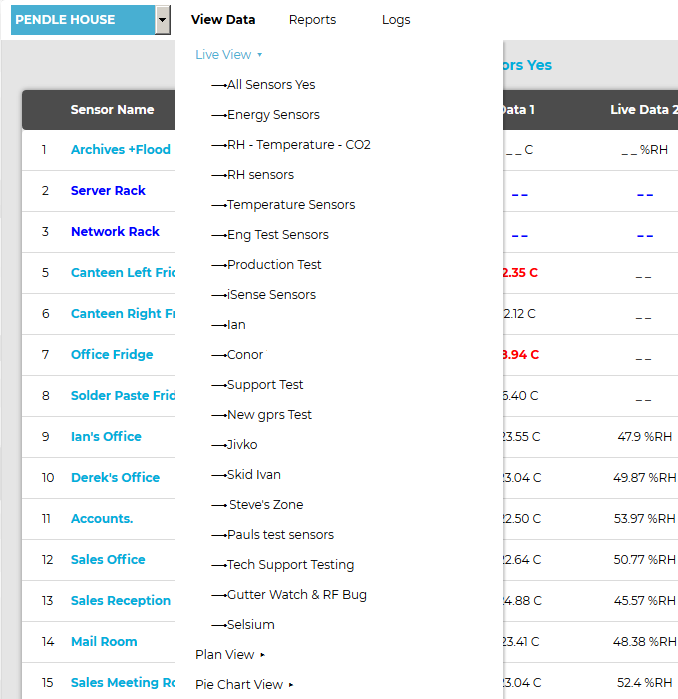
1.Click on Live View in the View Data drop-down menu.
•The Live View entry in the drop-down menu is expanded to display a list of all Zones associated with the selected Site. See Figure 1040 below:
Figure 1040
2.Click on the required Zone's name from the displayed list.
•A Live View [Site name] window is displayed, showing live data relating to the Sensors associated with the selected Zone. See Figure 1041 below:
Figure 1041
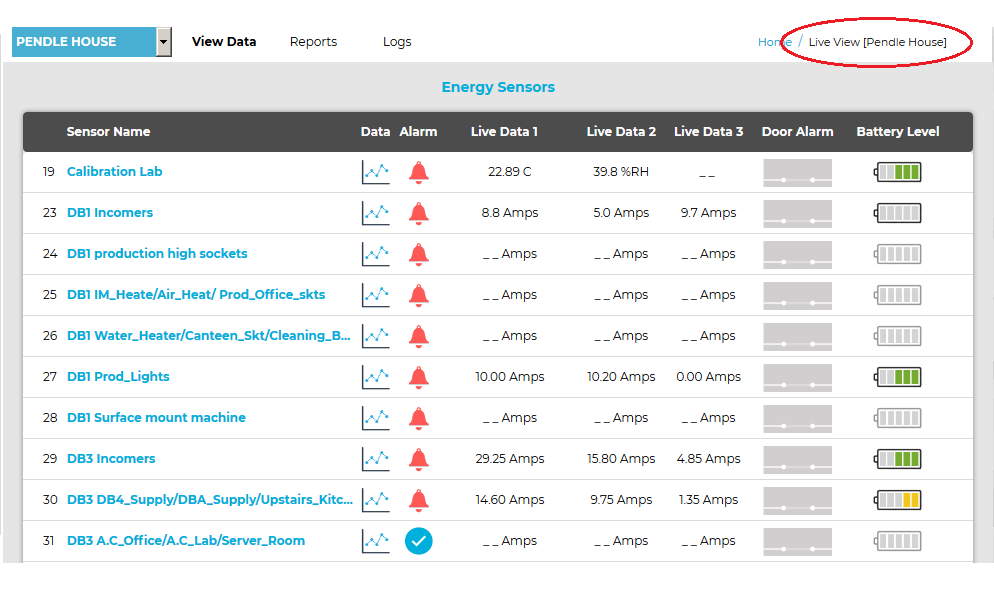
| Note: | For earlier versions of EMS, the Site Name may not be shown at the top of the window. |
•The following additional information is also displayed for each displayed Sensor:
3.In the displayed Live View [Site name] window -
Either:
Double click on a Sensor's name in the Sensor Name column.
Or:
Click on the Graph icon in the Data column for the required Sensor.
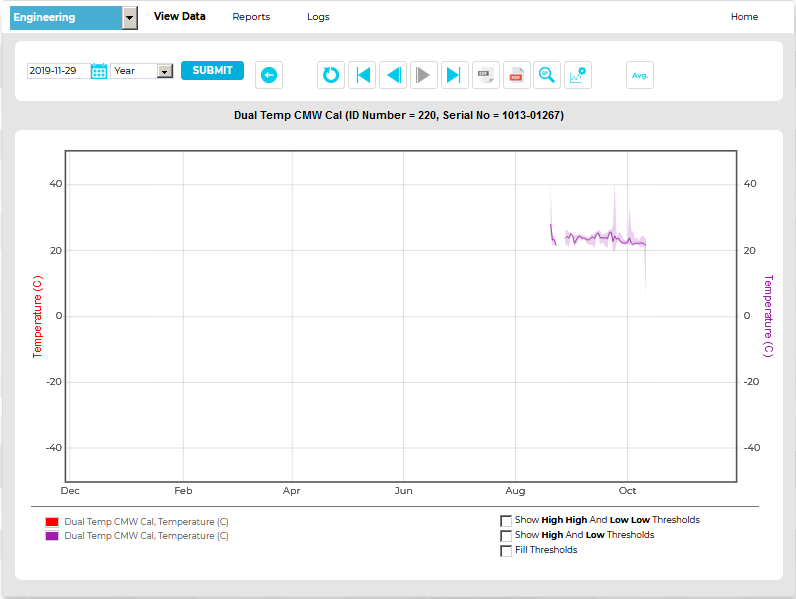
•The Chart View window for the selected Sensor is displayed. See Figure 1042 below:
Figure 1042
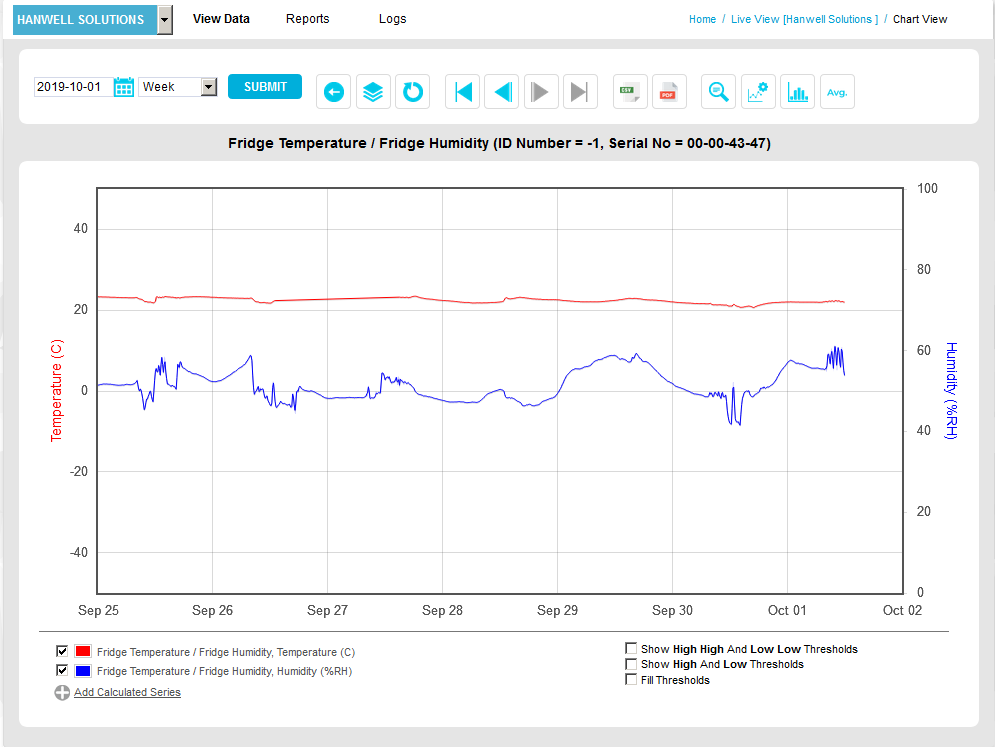
| Note: | For earlier versions of EMS, the Chart View window may have a slightly different appearance with different functionality available. See Figure 1043 below: |
Figure 1043
To Access a Graph View of Sensor Readings for the selected Zone:
1.Click on Graph View in the View Data drop-down menu.
•The Graph View entry in the drop-down menu is expanded to display a list of all Zones associated with the selected Site. See Figure 1044 below:
Figure 1044
2.Click on the required Zone's name from the displayed list.
•A Chart View [Zone name] window is displayed, showing a graph with traces/lines representing data from each Sensor associated with the selected Zone. See Figure 1045 below:
Figure 1045
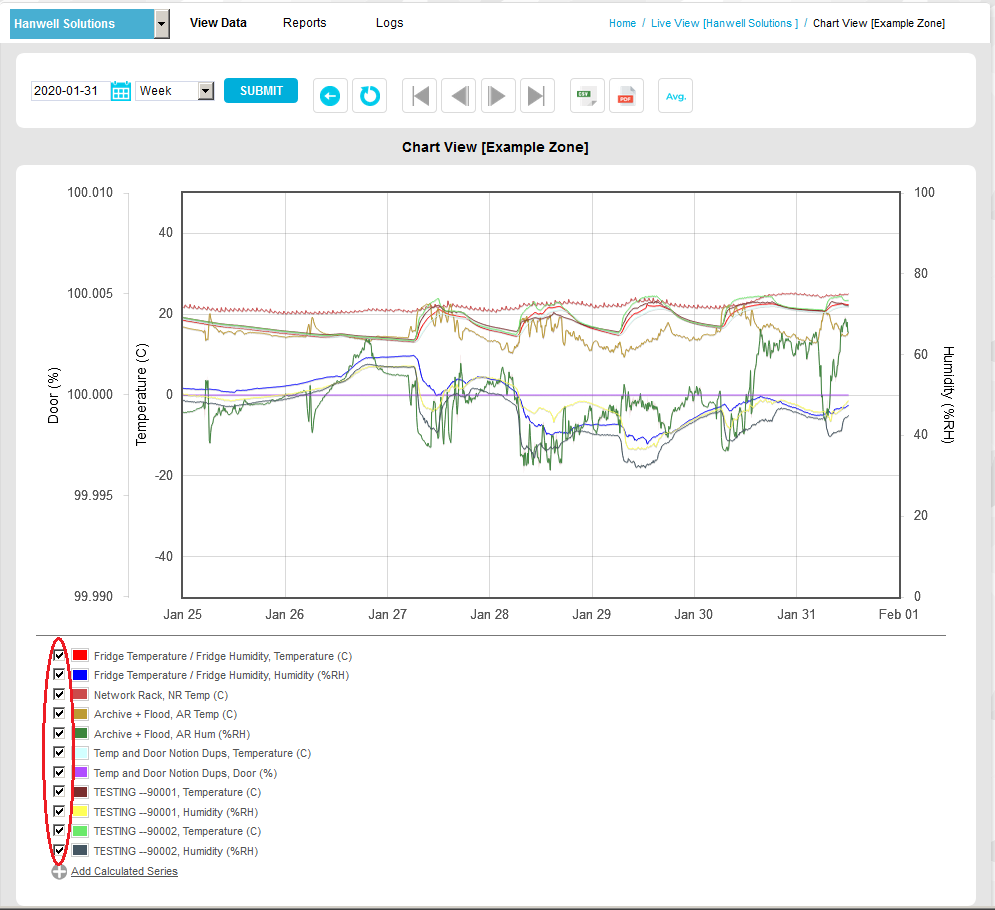
➢By default, data from all Sensors associated with the selected Zone is displayed in the Graph View window. To remove a Sensor's data display from the Graph Window, untick its box in the key below the chart. See Figure 1045 above
Plan View
To Access a Plan View of a Zone's Sensors:
1.Click on Plan View from the drop-down menu.
•The Plan View entry in the drop-down menu is expanded to display a list of all Zones associated with the selected Site. See Figure 1046 below:
Figure 1046
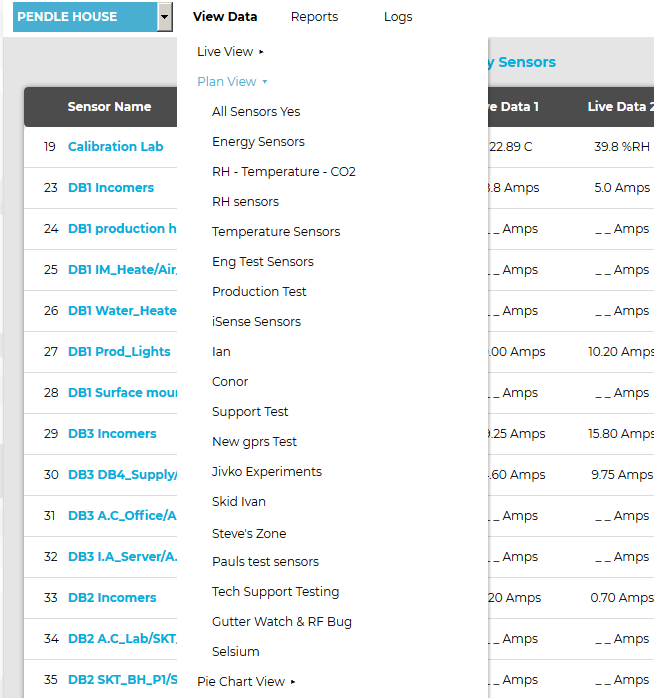
2.Click on the required Zone's name from the displayed list.
•A Plan View [Zone Name] window is displayed, showing a Plan view of the location of the selected Zone's Sensors and other information relating to the Sensors associated with the selected Zone. See Figure 1047 below:
Figure 1047
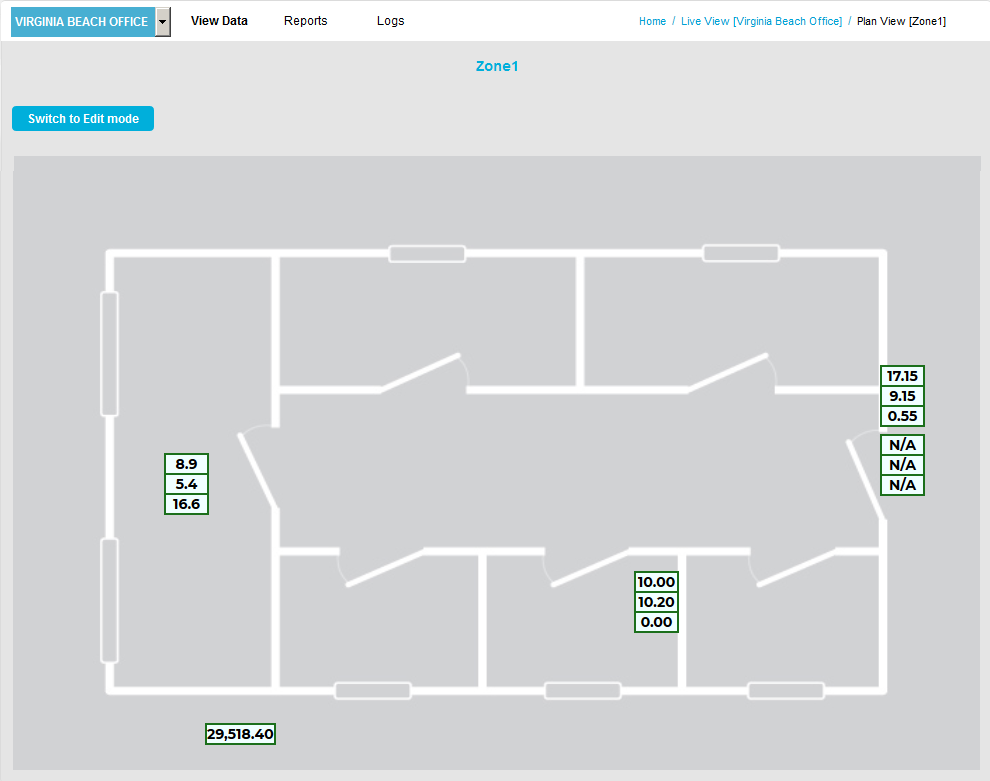
•Holding the mouse pointer over a Sensor displays a pop-up window listing its name and the Zone it is associated with.
Pie Chart
To Access a Pie Chart of Sensor Readings:
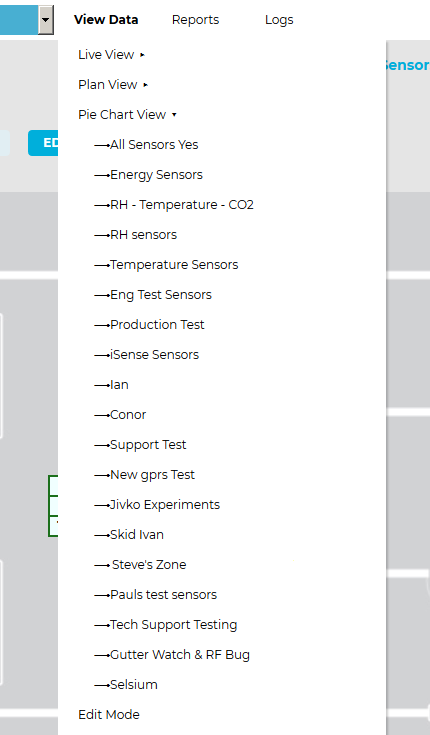
2.Click on Pie Chart View from the drop-down menu.
•The Pie Chart View entry in the drop-down menu is expanded to display a list of all Zones associated with the selected Site. See Figure 1048 below:
Figure 1048
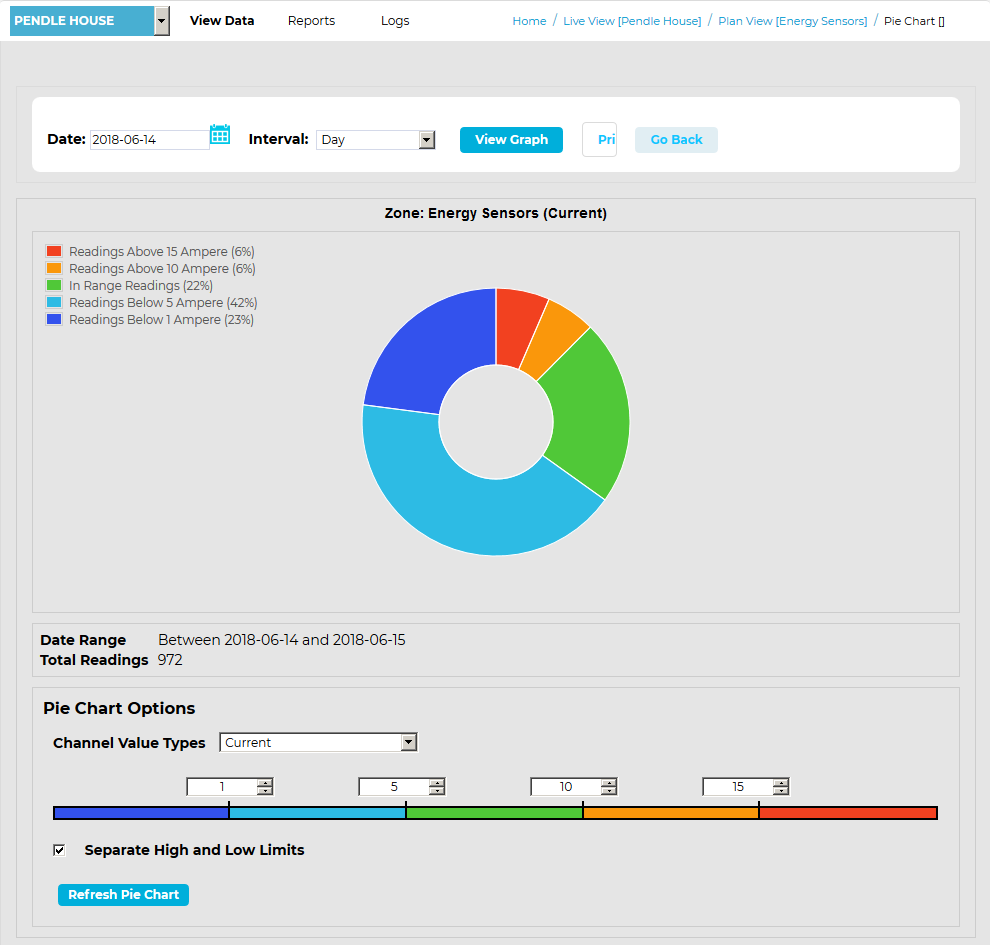
3.Click on the required Zone's name from the displayed list.
•A Pie Chart [Zone name] window is displayed, showing the percentage of Sensor readings, associated with the selected Zone, that are within or outside pre-defined ranges of values. See Figure 1049 below:
Figure 1049
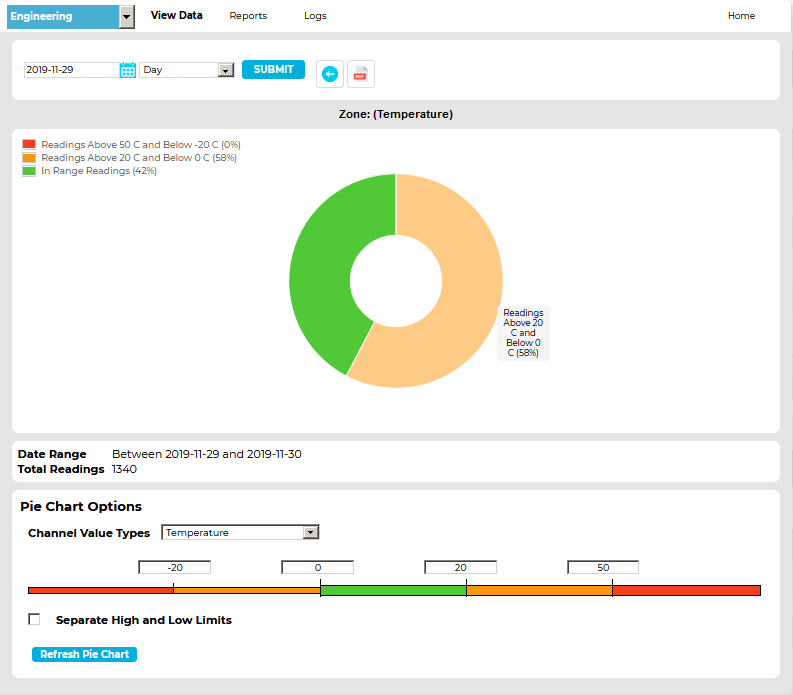
Note: For earlier versions of EMS, the Pie Chart window may have a slightly different appearance, with different functionality available.See Figure 1050 below:
Figure 1050
To View Sensor Data for a Sensor Group
Note: A Sensor Group is only visible to the User who created it and cannot be shared with or made visible to other Users.
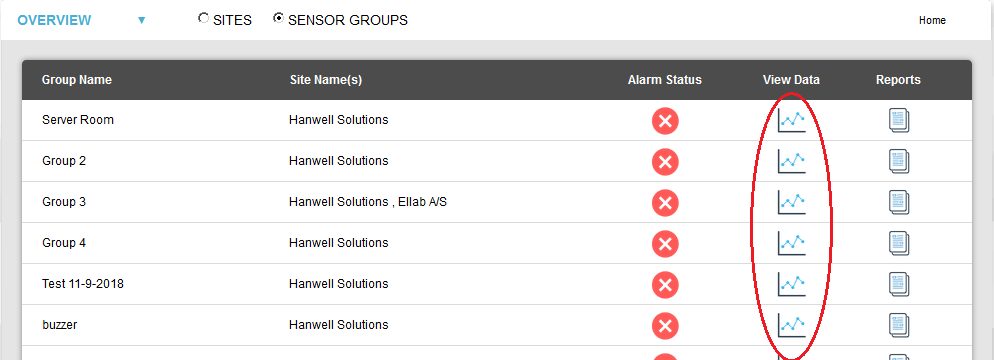
1.Check the SENSOR GROUPS radio button at the top of the Home page. See Figure 1051 below:
Figure 1051
![]()
2.Either:
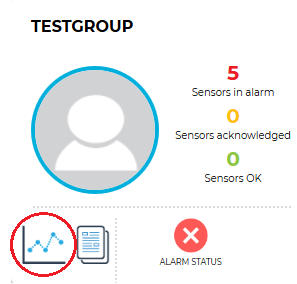
From the Graphical View, click on the View live data icon in the required Sensor Group's field. See Figure 1052 below:
Figure 1052
Or:
From the Table View, click on the Graph icon adjacent to the required Sensor Group in the View Data column. See Figure 1053 below:
Figure 1053
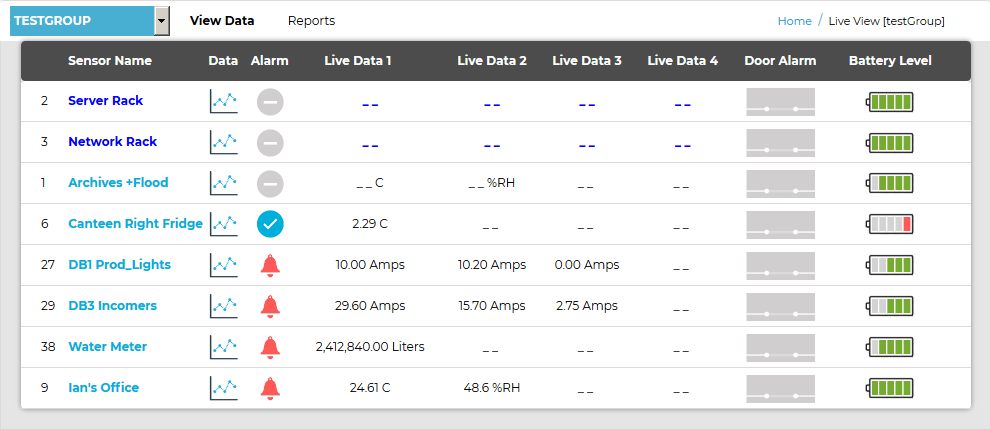
•A Live View [Sensor group name] window is displayed, showing live data relating to the Sensors associated with the selected Sensor Group. See Figure 1054 below:
Figure 1054
| Note: | You can display another Sensor Group's associated Sensors in the Live View window by selecting the required Sensor Group from the drop-down list at the top left of the window. See Figure below: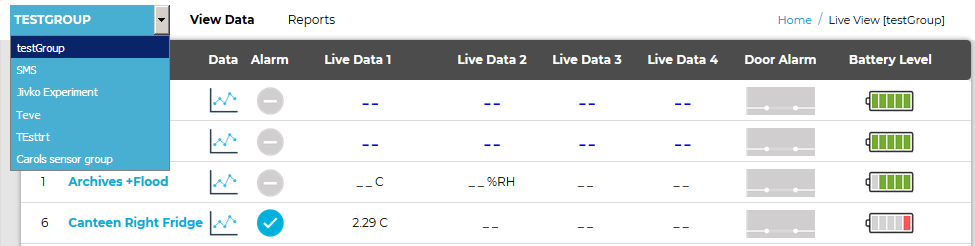 |
The following additional information is also displayed for each displayed Sensor:
3.Either:
Double click on a Sensor's name in the Sensor Name column.
•The Live Chart [Sensor name] window for the selected Sensor is displayed in a new window.
Or:
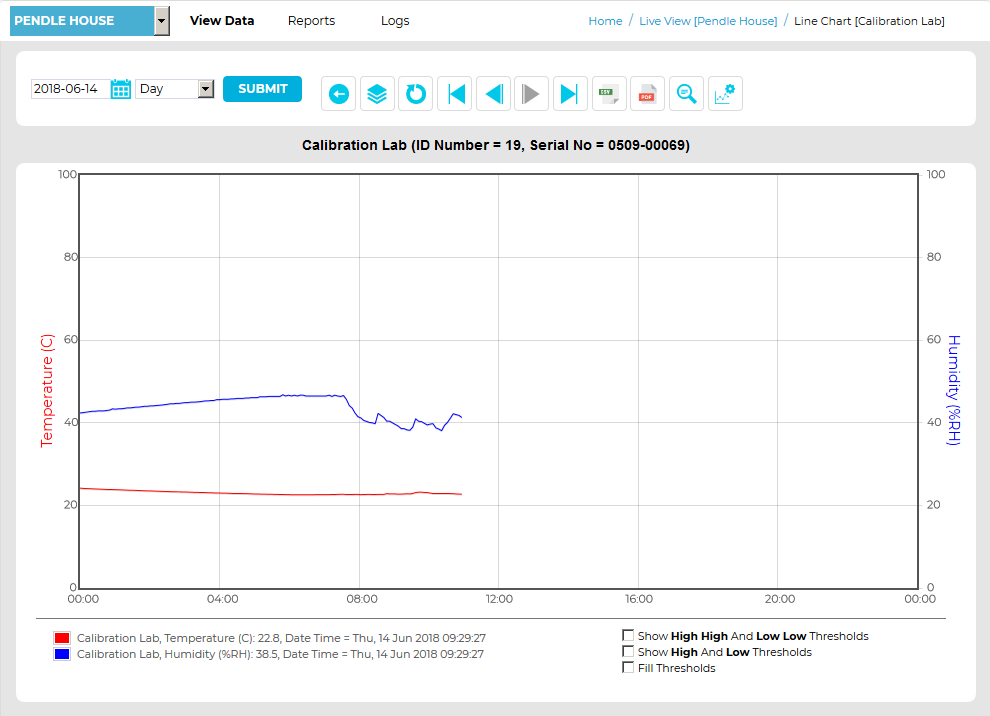
Click on the relevant Graph icon in the Data column of the Live View [Sensor group name] window.
•The Live Chart [Sensor name] window for the selected Sensor is displayed within the existing window.
See Figure 1055 below:
Figure 1055
Sensor Information
•Letting the mouse pointer hover over a Sensor Name in the Live View Table displays information in a popup window relating to the selected Sensor regarding Location, Alarms, Date and Time, Battery, Sensor Status etc. See Figure 1056 below:
Figure 1056
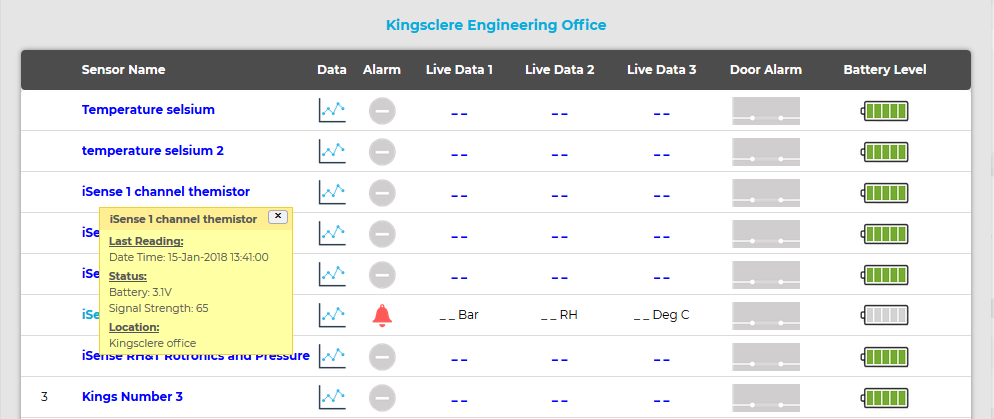
➢Click on the x or move the mouse pointer away from the Sensor's Name to close the popup window.
| Note: | New Alarms will only be triggered for a Sensor Channel or Channels if any previous alarms of the same type on the Channel or Channels have been Reset, following Acknowledgement: To Reset Individual Alarms To Reset Multiple Alarms However, data from the Sensor Channel or Channels still in an Alarm state can still be viewed in the normal way: Viewing Sensor Data for a Site Viewing Sensor Data for a Sensor Group |