Contents
The Overlay Sensors function allows the comparison of two or more Sensor/Transmitters' data.
•This function is particularly useful if you have an outdoor Sensor/Transmitter and want to see if the outdoor conditions are driving the conditions indoors.
Overlaying Sensor/Transmitter Data on a Graph
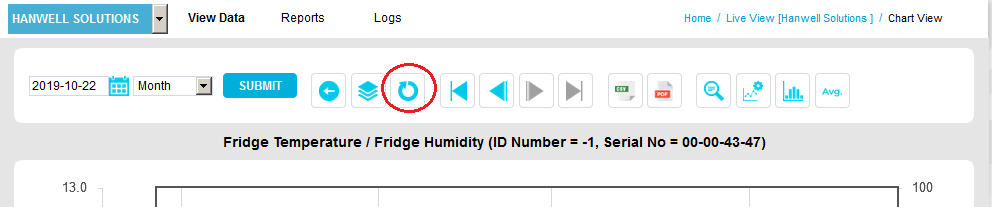
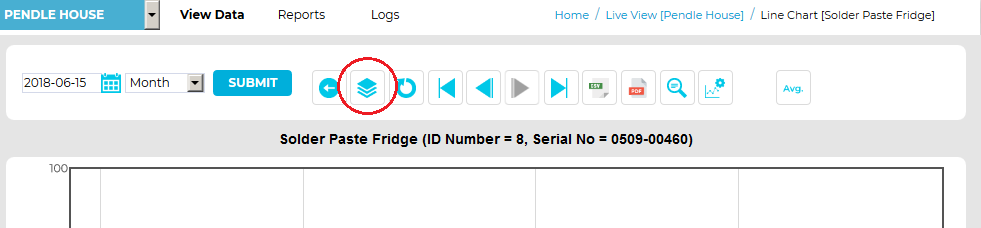
1.Click on the Overlay Sensors button top menu bar of the Line Chart [Zone name] window. See Figure 1134 below:
Figure 1134
| Note: | If Graph View has been selected from the View Data drop-down menu, the Overlay Sensors button will not be displayed. |
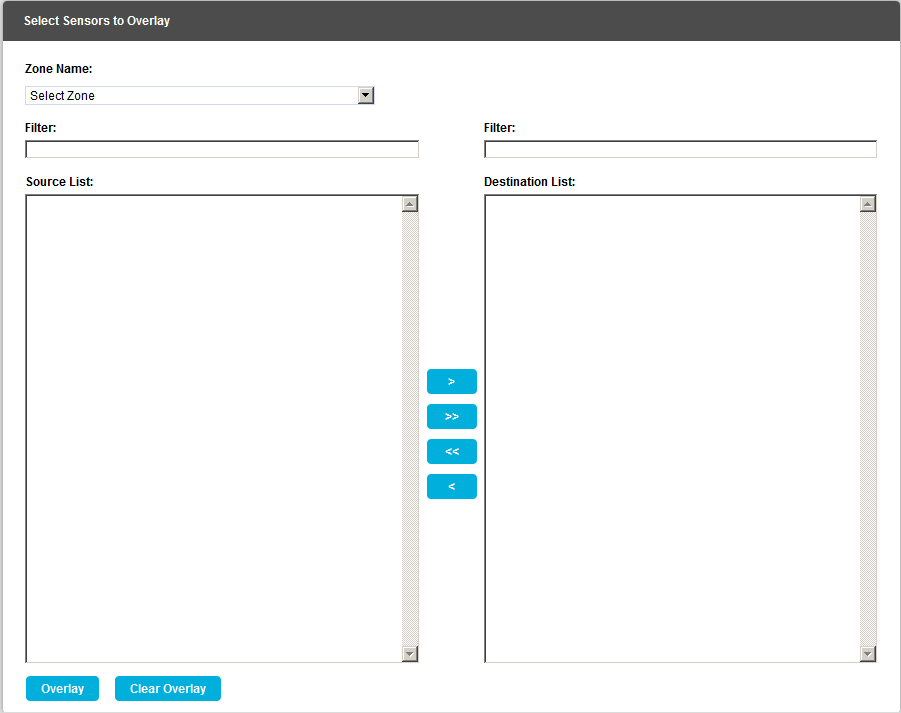
•The Select Sensors to Overlay Graph window is displayed. See Figure 1135 below:
Figure 1135
2.Select the Zone containing the relevant Sensors from the Zone Name: pull-down list. See Figure 1136 below:
Figure 1136
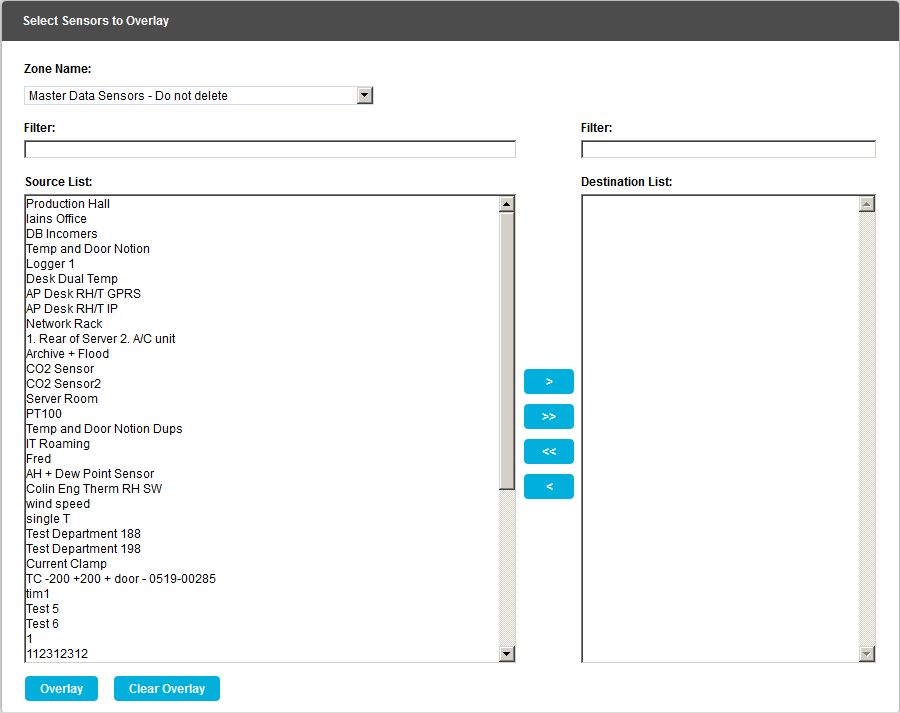
•Sensors associated with the selected Zone will appear in the left hand Source List: panel.
➢If there are a large number of Sites/Contacts, the required Site/Contact can be found by using the Filter:.
3.To Add Sensors:
•To add a single Sensor to the Overlay Graph group, select a single Sensor in the Source List: panel and click on the single the right-facing arrow to move the selected Zone's Sensor to the right-hand Destination List: panel.
➢Hold down the Ctrl key as you click on the Sensor names to select more than one Sensor.
•To add all of a Zone's Sensors to the Overlay Graph group, click on the double arrow to move all of the selected Zone's Sensors to the right-hand Destination List: panel.
| Note: | Further Zones can be selected from the Zone Name: drop-down list and their associated Sensors added to the Destination List: using the procedures above. |
To Remove Contacts:
•To remove a single Sensor from the Overlay Graph group, select a single Sensor in the Destination List: panel and click on the single left-facing arrow to move the selected Sensor to the Source List:
•To remove all Contacts from the Overlay Graph group, click on the double left facing arrow to move all of the group's Contacts to the Source: list.
See Figure 1137 below:
Figure 1137
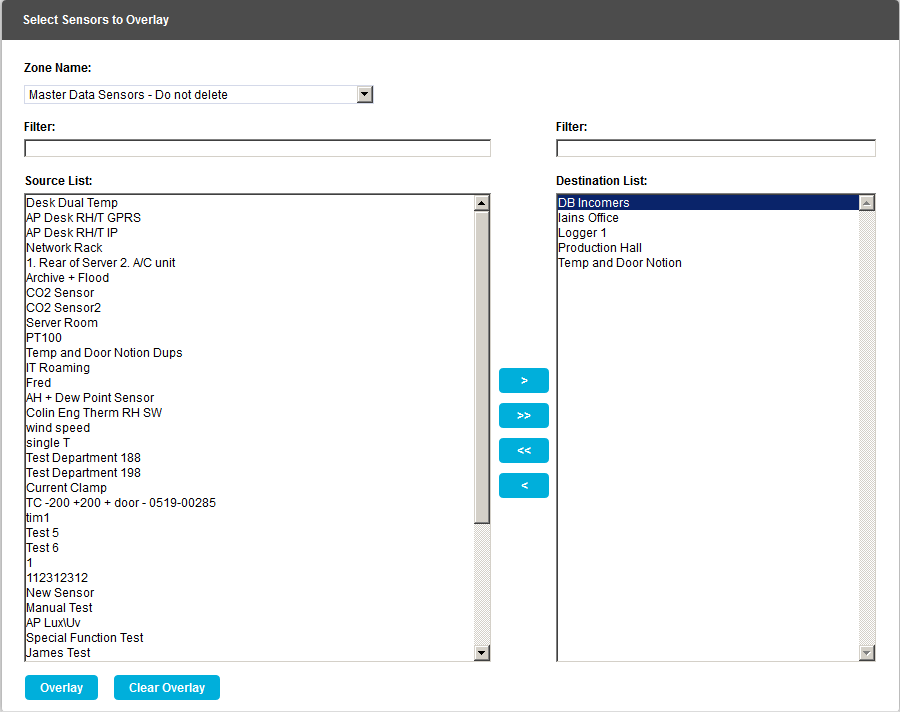
4.Once you are happy with your selection, scroll to the bottom of the window and click on Overlay. See Figure 1138 below.
Figure 1138

•After selecting Overlay, you will be asked to confirm your selection. See Figure 1139 below:
Figure 1139
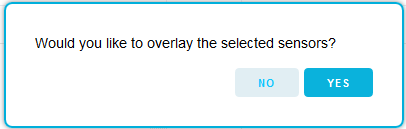
5.Click on Yes to confirm and to proceed with overlaying data on the graph.
Click on No to cancel the overlay.
•An updated graph window will be displayed, with the selected Sensor/Transmitter data overlaid over the original graph. See Figure 1140 below:
Figure 1140
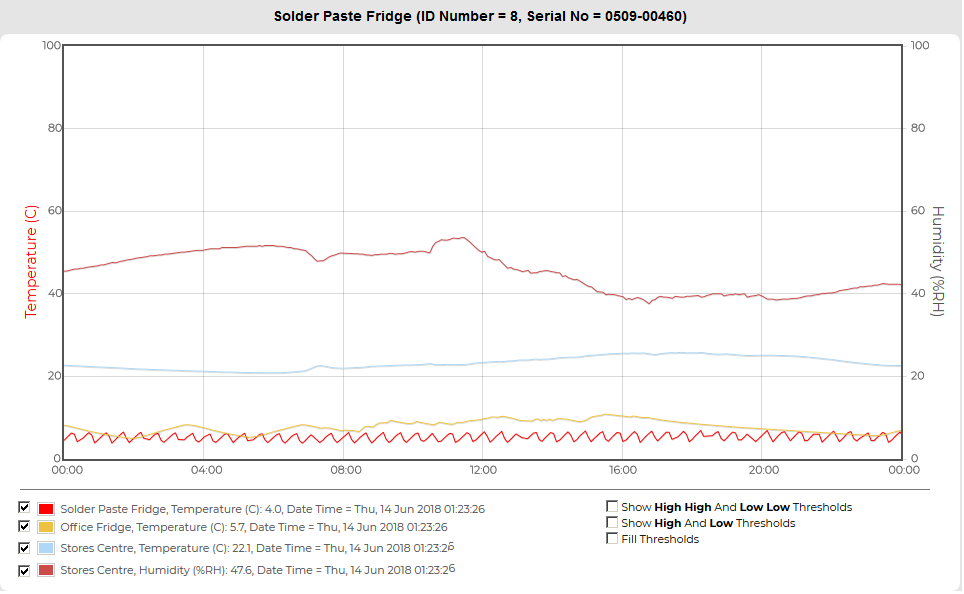
The overlaid data is included in the colouredcoloredKey below the Graph Window.
➢Use the scroll bars to the right of the Key (if displayed) to view information on all of the represented Senor/Transmitter data.
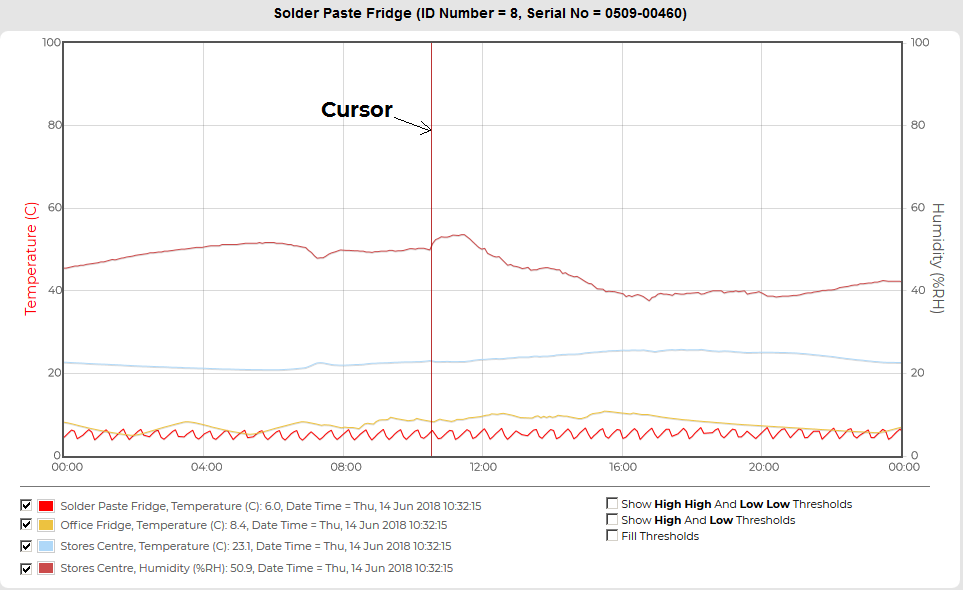
To view specific values on the graph, a cursor can be applied to the graph.
➢Move the mouse pointer over the graph window to display the cursor. See Figure 1141 below.
➢If you keep the mouse pointer within the graph window, moving the mouse pointer to the left and right will move the cursor across the screen, changing the Sensor/Transmitter data values displayed in the Key as the date and time changes.
Figure 1141
•To remove the overlay
Either:
i.Select the Overlay Sensors button to display the Select Sensors to Overlay Graph window.
ii.Scroll to the bottom of the Source List: and select Clear Overlay. See Figure 1142 below.
Figure 1142
•The graph is returned to displaying the original data.
Or:
Click on the Reset graph button to remove the overlay from the chart. See Figure 1143 below.
Figure 1143