Navigation:
System Configuration Sensors > Configuring Sensors > Calibration - General > Calibration - Using EMS >> Setting Default Scale Values
Setting Default Scale Values

Contents
Introduction
Each Sensor/Transmitter has a Graph Scale for each of its channels, setting the upper and lower limits of any graph plots.
•In Edit Mode there are two ways to set Graph Scale values:
Either:
Edit the Default Scale Values.
| Note: | Only Users with Administrator privileges or the User Chart Scale Configuration Permission assigned to them individually, inherited from an assigned Role or granted in addition to those inherited from an assigned Role can change the Default Scale Values. It is recommended that a User Chart Scale Role is setup with the User Chart Scale Configuration Permission assigned to it and then assign the Role to all Users who may be required to alter Default Scale Values. |
Or:
Use Auto Scale.
Default Scale Values Set in Edit Mode Will Be Used If:
•The User has not set any Chart Scale values.
•The User resets their scale to Default.
•If a User is viewing a chart for the first time.
| Note : | Changing the Default Chart Scales in Edit Mode does not overwrite the Users' Chart Scale settings. |
Editing or Setting the Default Scale Values
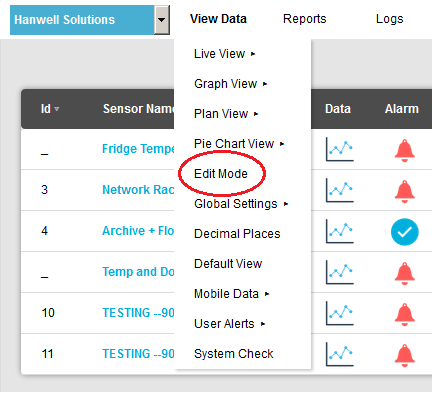
1.From the required Site's Live View window, select Edit Mode from the main View Data menu. See Figure 825 below:
Figure 825
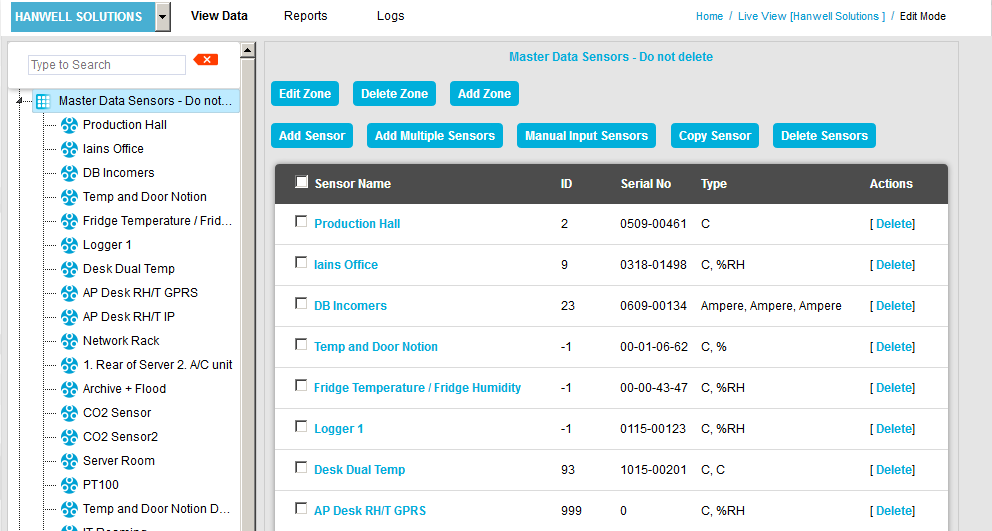
2.In the left-hand menu of the displayed Editing and Configuration window, click on the + symbol next to the Zone containing the Sensors to be accessed. •The selected branch will expand showing all of the available sensors for the selected Zone. See Figure 826 below: Figure 826
3.Click on the + symbol next to the Sensor name to view the properties of the Sensor that is to be Edited. •This will expand the branch again to show the Properties folder for the Sensor. See Figure 827 below: Figure 827
4.Click on the + symbol next to Properties to access the individual Sensor properties. •This will expand the branch again to show the Sensor's configurable Properties. See Figure 828 below: Figure 828
5.Click on the + sign next to the Calibration icon to expand the Calibration property entries. See Figure 829 below: Figure 829
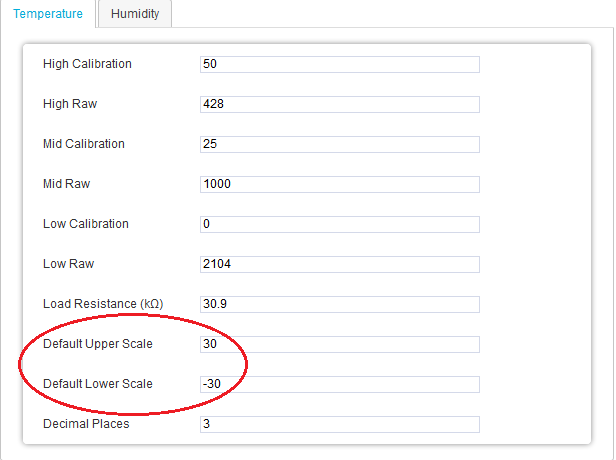
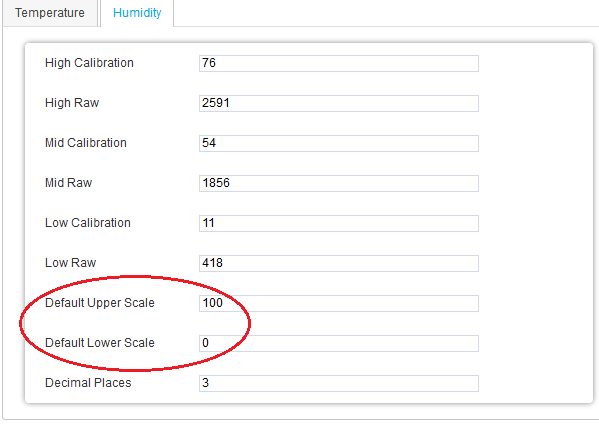
6.Click the on the Temperature, or Humidity icon on to display the Temperature or Humidity window for the selected Sensor/Transmitter (applies to this example; clicking on icons representing other parameters such as CO2 or Voltage will display windows appropriate to the selected parameter). See Figure 830 below: Figure 830
7.Enter the required Default Upper Scale and Default Lower Scale limits into the Default Upper Scale: and Default Lower Scale: fields respectively. See Figure 831 above.
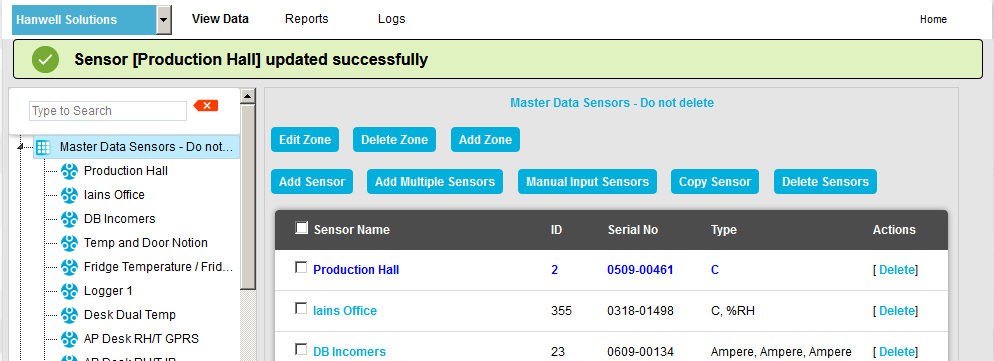
8.Select Update to confirm the details. •If the Update has been successful, the following message will be displayed. See Figure 831 below: Figure 831
|
||
|


•The Site's Edit Mode window is displayed. See Figure 832 below:
Figure 832
•By default, the Sensor and Zone editing/configuration window for the Zone at the top of the left-hand menu is displayed.
•To display another Zone's Edit Mode window, click on the entry for the required Zone in the left-hand menu. For an example, see Figure 833 below:
Figure 833
2.Either:
i.In the left-hand list of the Zone's Edit Mode window, click on the small 'arrow' symbol to display a list of the Sensors associated with the Zone. See Figure 834 below:
Figure 834
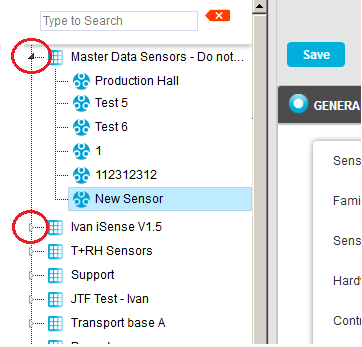
ii.In the left-hand list, click on the required Sensor's icon ![]() .
.
Or:
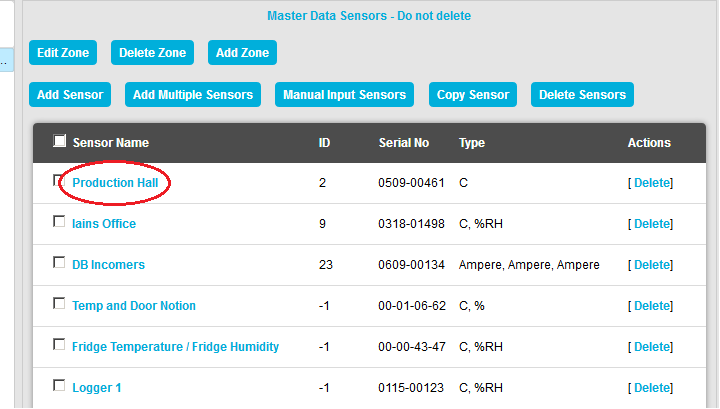
In table in the Zone's Edit Mode window, click on the required Sensor's name in the Sensor Name column. See Figure 835 below:
Figure 835
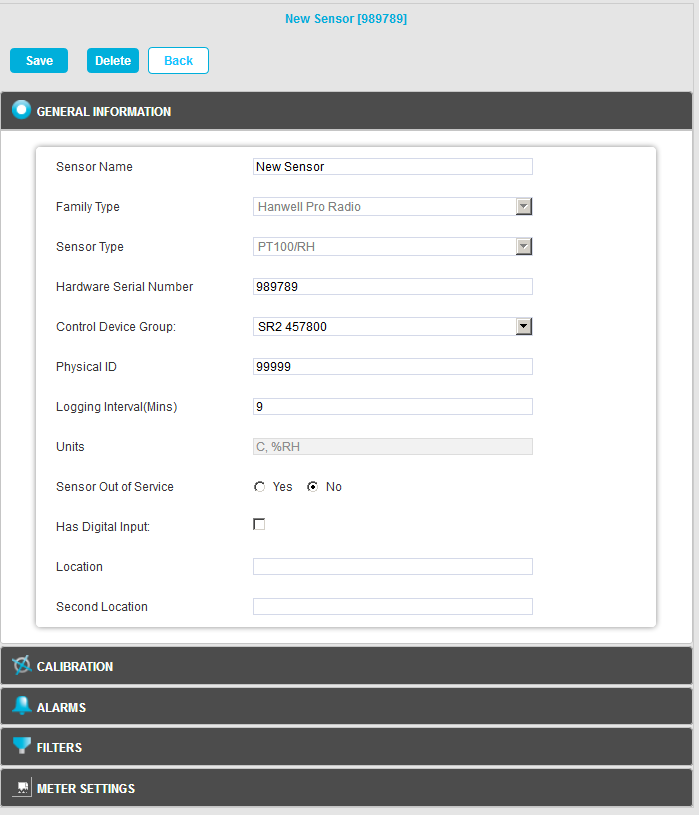
•The Edit Mode window for the selected Sensor is displayed. See Figure 836 below:
Figure 836
3.Click the on the Calibration field to expand the Calibration pane. See Figure 837 below:
Figure 837
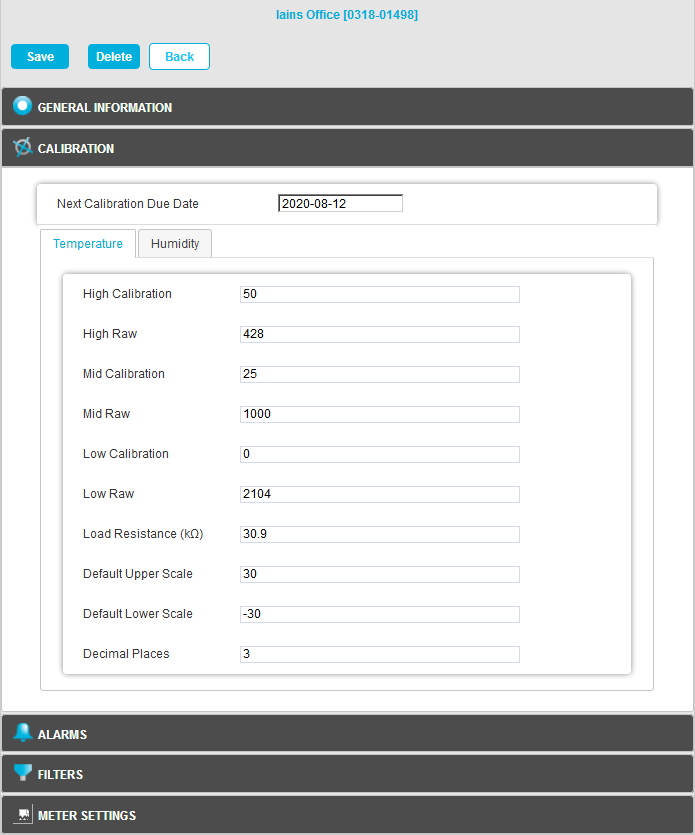
4.Click the on the Temperature or Humidity tab to display the Temperature or Humidity panes for the selected Sensor/Transmitter. See Figure 838 below.
Figure 838
|
|
5.These panes shown above apply to this example; clicking on icons representing other parameters such as CO2 or Voltage will display windows appropriate to the selected parameter.
6.Enter the required Default Upper Scale and Default Lower Scale limits into the Default Upper Scale: and Default Lower Scale: fields respectively. See Figure 838 above.
| Note: | Graph Scale ranges can be set to be as narrow or as wide as required but, be aware that, if a Graph Scale range is set across a very narrow range of values and the Sensor starts to read outside of this range, nothing will be seen on the graph. |
7.When you are happy with the new Default values, click on Save.
➢Click on the Back button to cancel any changes to the Default values.
•If the Update has been successful, you will be returned to the Zone's Edit Mode window and the following message will be displayed. See 839 below:
Figure 839