
Contents
The User can define the configuration of a Line Chart's scale.
Changing the Scale (Line Charts Only)
1.Click on the Scale button ![]() in the top menu bar of a Line Chart's Chart View window. See Figure 1181 below:
in the top menu bar of a Line Chart's Chart View window. See Figure 1181 below:
Figure 1181
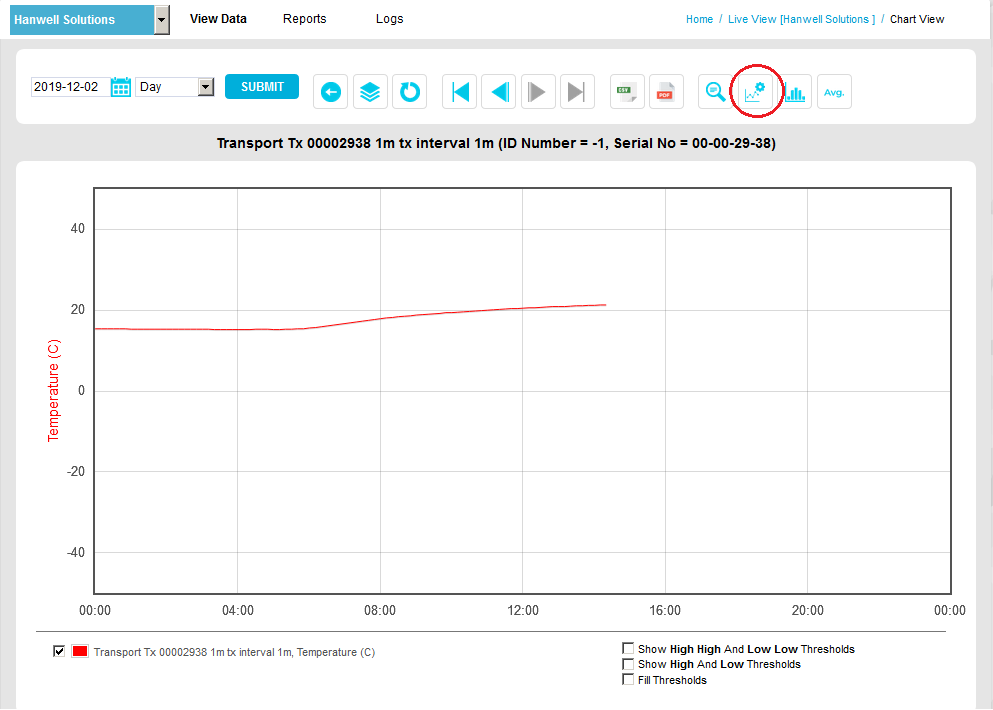
| Note: | Bar Chart scales are permanently set to Auto Scale. |
•The Change Sensor Overlay Scale - Graph Scale window is displayed. See Figure 1182 below:
Figure 1182
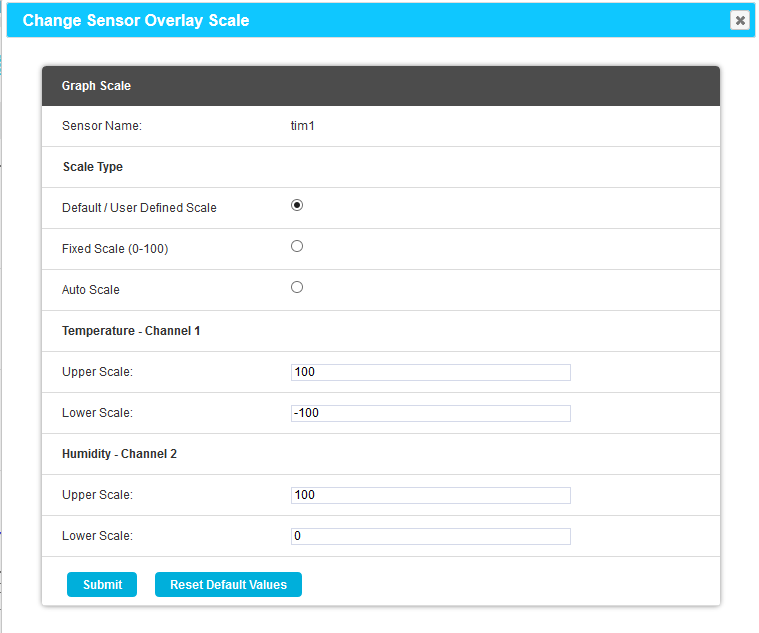
2.Select from the options available in the Graph Scale window:
•Scale Type
Select the Scale Type you require by clicking the option button next to the Scale type required:
➢Default/User Defined Scale
Some Sensor/Transmitters have a very wide operating range but the Sensor/Transmitter in question may be being used at one end of the range. A User Defined Scale allows a more detailed view of the data.
If the Change Scale Values box is ticked, a User, with the right Permissions assigned (see Note above), can define upper and lower limits for each Sensor/Transmitter's Chart Scales.
The relevant values for each Sensor/Channel are entered into the Upper Scale: and Lower Scale: fields.
oThe Upper Scale: and Lower Scale: fields are initially populated with their Default values when the Change Scale Values box is ticked.
•Fixed Scale (0-100)
Each Sensor/Transmitter installs with a Default Scale which would cover the maximum range for that Sensor/Transmitter. This is Scale setting is OK if the Sensor/Transmitter is going to be used over its range if it’s to be used over a smaller range then a User Defined Scale may be more appropriate, see above.
This feature allows the graph Scale to be set automatically, Auto Scale will set the graph Scale to a very tight range which covers the range for the data displayed. This gives a much expanded view of the data and may confuse as the data can look like it is changing dramatically.
•Change Channel/Parameter Scale Values
You can enter Upper Scale and Lower Scale values for each Channel/Parameter into their respective boxes and update them by clicking Submit.
| Note: | Only Users with Administrator privileges or the User Chart Scale Configuration Permission assigned to them individually, inherited from an assigned Role or granted in addition to those inherited from an assigned Role can change Chart Scale Values. It is recommended that a User Chart Scale Role is setup with the User Chart Scale Configuration Permission assigned to it and then assign the Role to all Users who will be required to alter Chart Scale Values. |
3.Select Submit.
•The graph will re-draw with the new Scale settings. See Figure 1183 below for an example:
Figure 1183
Exampe 1
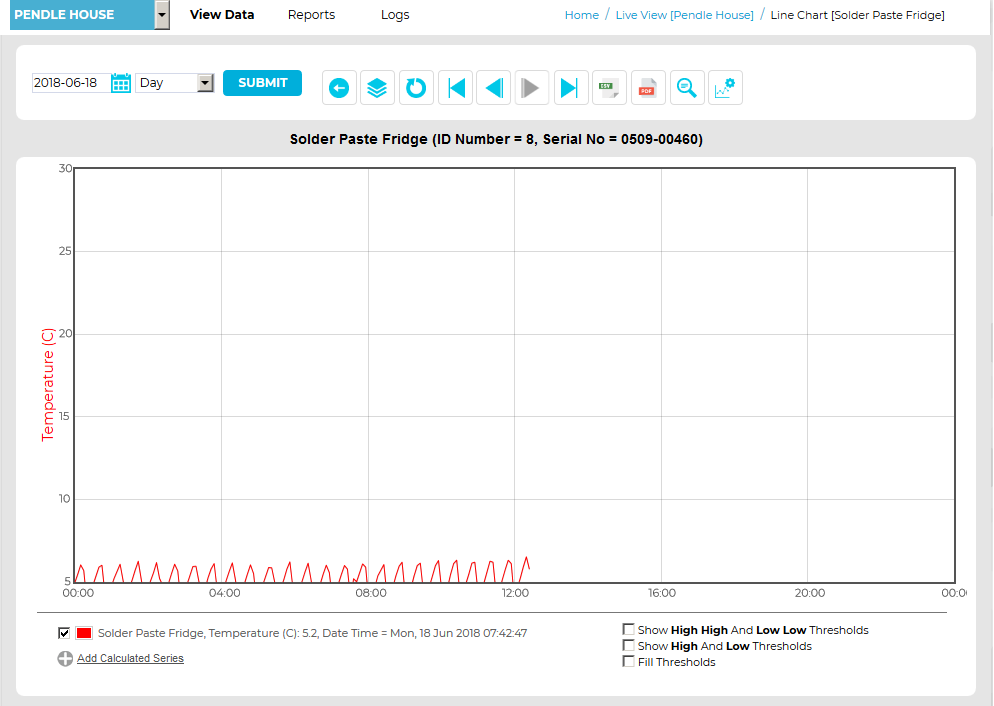
Example 2
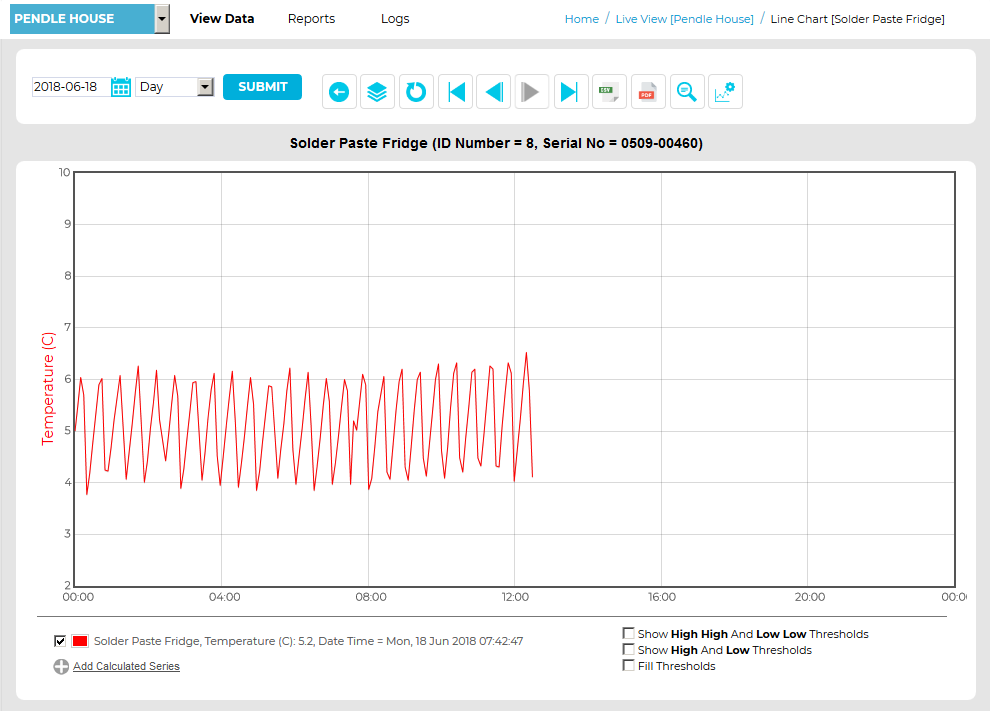
•Both Example 1 and Example 2 use identical data but, in Example 1, the Scale Type has been set to Fixed Scale (0-100) and, in Example 2, the Scale Type has been set to Auto Scale.
Default Scale Values
A Sensor's Default scale values can be applied by clicking on the Reset Default Values button (Set Default button for EMS versions prior to V1.0.8) in the Change Sensor Overlay Scale - Graph Scale window.
| Note: | Following this action, the current chart, as displayed, will not be redrawn. The Default values will only be applied to the chart when it is next displayed. |