Navigation:
EMS Outputs > Viewing Sensor Data > Graphical Data >> Start Date and Interval
Start Date and Interval

Contents
To Change the Start Date of a Graph's Time Period
•The Start Date is the date of graph's first data point.
| Note: | The Graph window defaults to displaying the current day’s data. |
Changing the Start Date
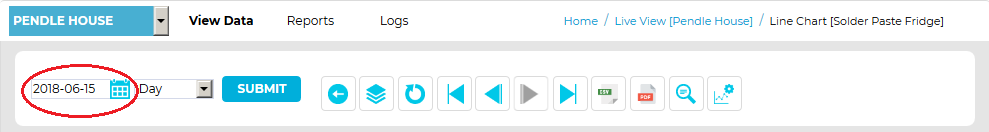
In the field in the Live View [Site name] window, shown in Figure 1130 below:
Figure 1130
Either:
Click on the calendar icon to select a Start date.
Or:
Manually enter a Start date into the Date: box in the form: yyyy-mm-dd.
•See Figure 1130 above:
•In this example, the Start Date has been changed to the 15th June 2018.
•The Data Interval is the date range of the data displayed on the graph.
| Note: | The Graph window defaults to displaying the current day’s data. |
Changing the Data Interval
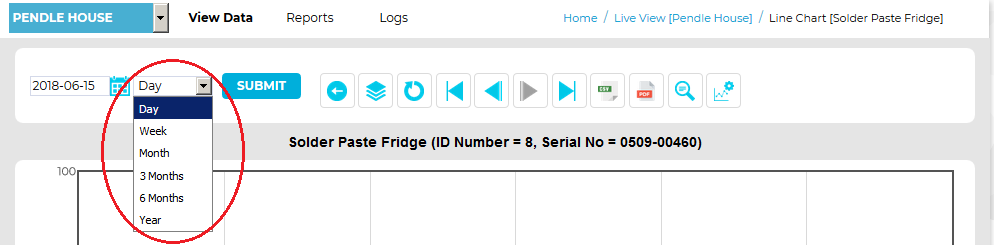
1.Select Day, Week, Month, 3 Months, 6 Months or Year from the drop-down list shown in Figure 1131 below:
Figure 1131
•To view data for an interval of a Week, enter, or select from the calendar, a date that is a week or more prior to the current date.
•To view data for an interval of a Month, enter, or select from the calendar, a date that is a month or more prior to the current date.
•Similarly, to view data for intervals of 3 Months, 6 Months or a Year, select dates from the calendar that are, respectively, 3 months or more, 6 months or more or a year or more prior to the current date.
2.Click on the Submit button to generate a graph with the selected parameters applied.
•The graph is displayed for data over the chosen Data Interval and from the Start Date.
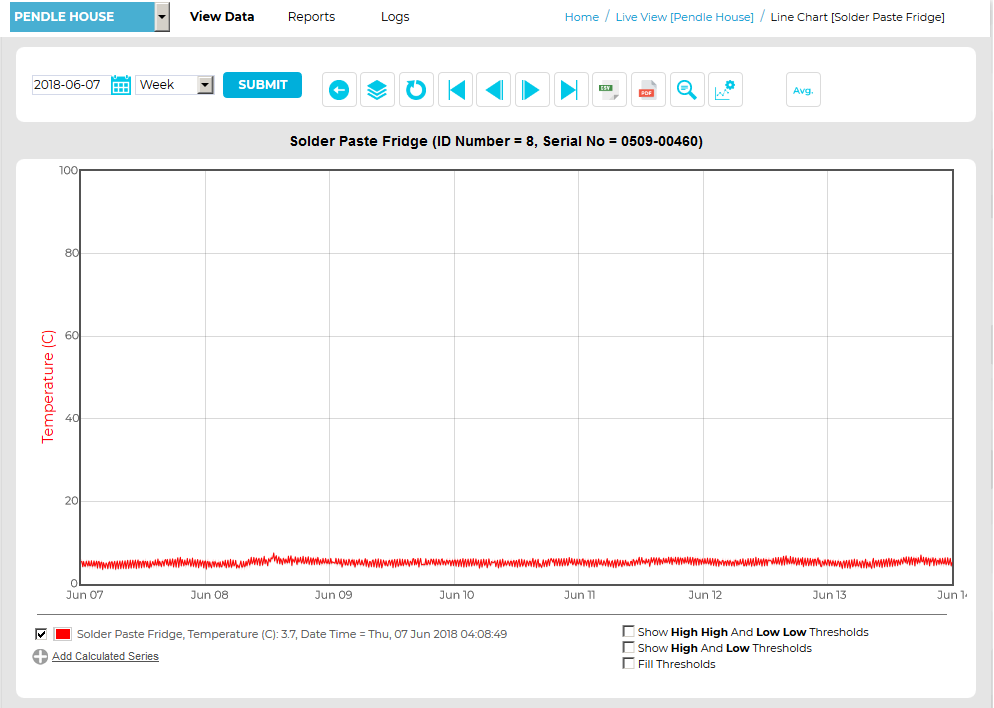
•For an example of data with a Start Date of 7th June and an Interval of a week. See Figure 1132 below:
Figure 1132
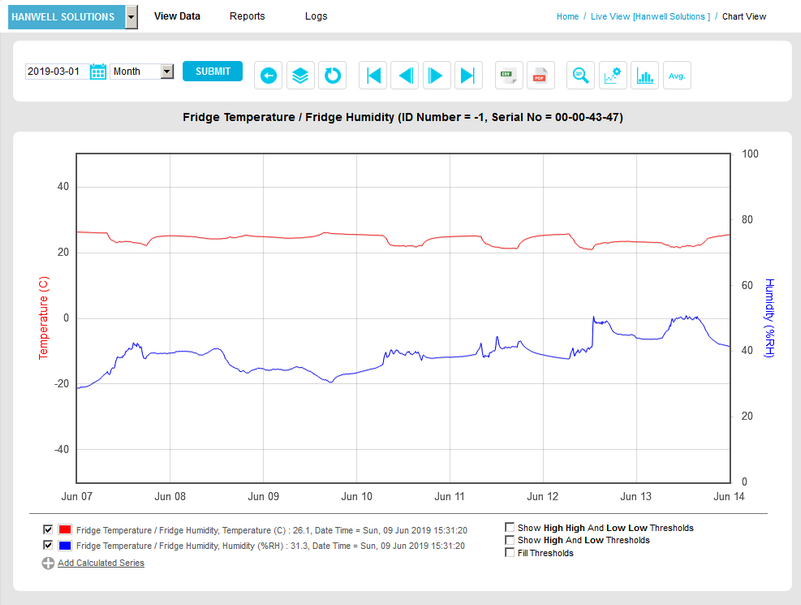
•For an example of data with a Start Date of 1st March and an Interval of a Month. See Figure 1133 below:
Figure 1133