Contents
•Selecting Channels to Display
➢To Add a Comment to a Saved Note
•Current or Pulse Count Sensor Data
Line Graphs
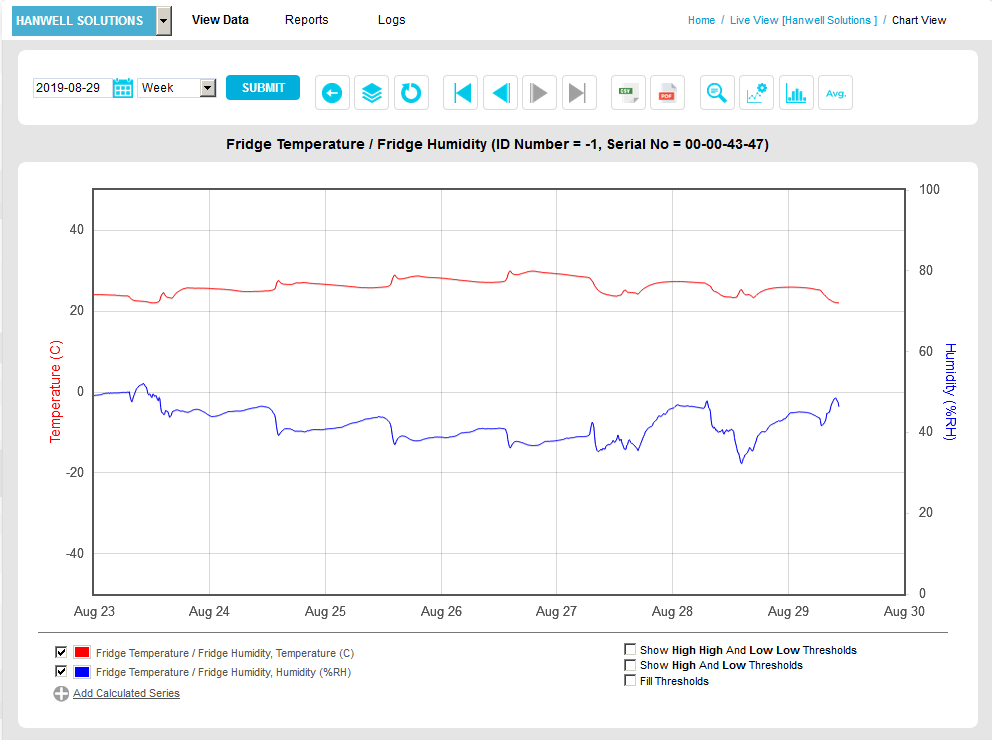
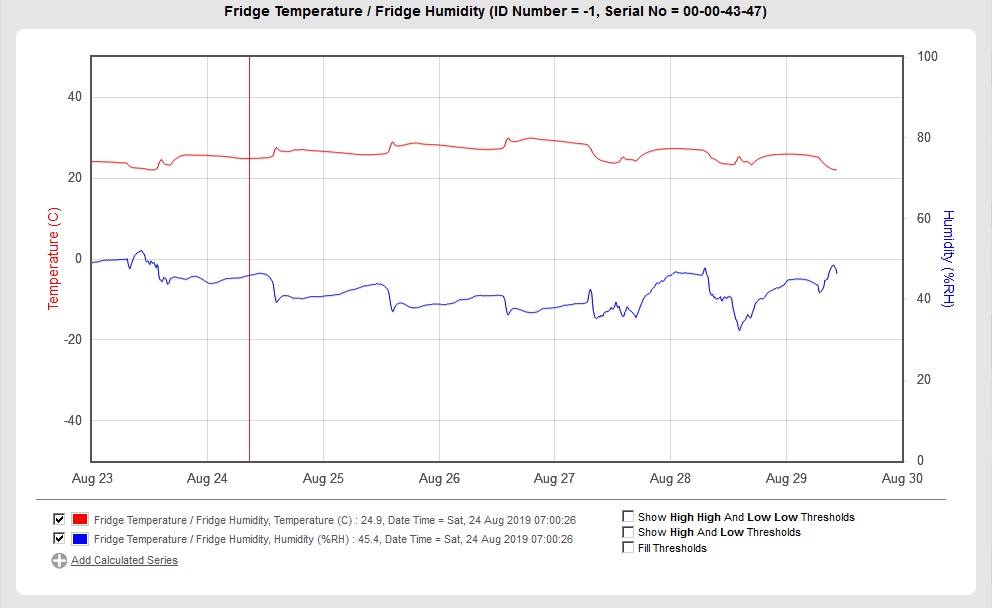
The majority of Sensors will display live data as Line Graphs, such as shown in Figure 1155 below:
Figure 1155
| Note: | It is only possible to select specific Channels to display from EMS Version 1.0.9 onwards. |
Each Channel represented on the Line Graph is represented in the key on the bottom left of the Chart View window; by default, all of the selected Sensor's Channels are shown.
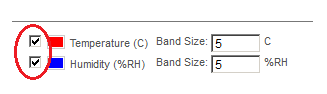
1.Tick/Untick the box adjacent to the relevant Channel to, respectively, display it in or remove it from the Graph. See Figure 1156 below:
Figure 1156
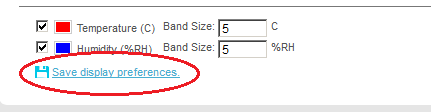
2.Click on the displayed Save display preferences link. See Figure 1157 below:
Figure 1157
•The Line Graph is displayed with the selected Channels added/removed.
| Note: | At least one Channel must be displayed on the Graph. |
Line Graphs can be annotated with notes as follows:
1.Hold the mouse pointer over the point on the graph's line plot that the note will apply to. See Figure 1158 below:
Figure 1158
2.Double click the left-hand mouse button.
•The Add Note to Graph window is displayed into which you can type notes concerning the highlighted data point. See Figure 1159 below:
Figure 1159
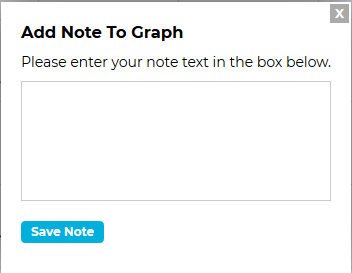
3.Click on Save Note.
•The note is saved and represented on the Line Graph by an icon. See Figure 1160 below:
Figure 1160
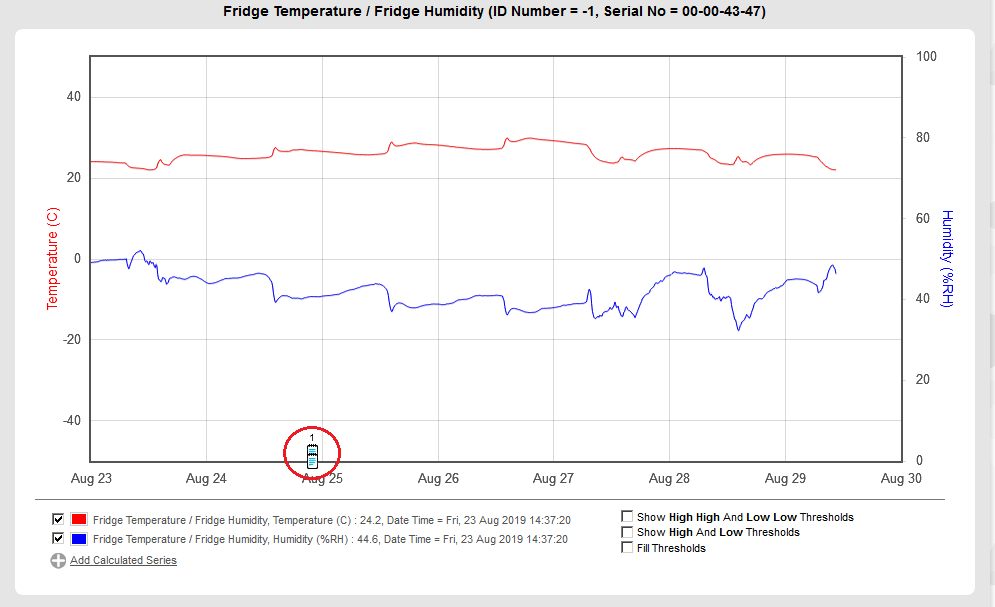
•Further notes can be added to the graph by repeating steps 1 - 3 above.
| Note: | Saved Notes cannot be deleted or edited directly once saved, though comments can be added to them; see To Add a Comment to a Saved Note below. |
Click on the required Note Icon on the graph.
•The Graph Note window is displayed showing the saved Note. See Figure 1161 below:
Figure 1161
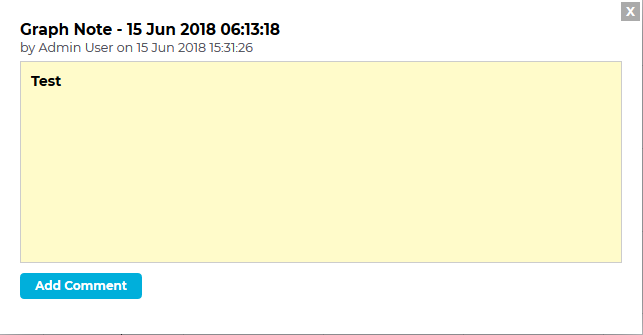
To Add a Comment to a Saved Note
1.Display the Graph Note window as above.
2.Click on Add Comment.
•The Add Comment window is displayed. See Figure 1162 below:
Figure 1162
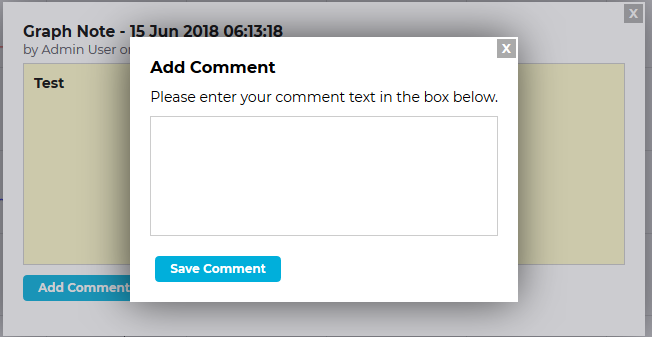
3.Type in the required comment for the note.
4.Click on the Save Comment button.
•The Graph Note window is displayed again with the new comment added. See Figure 1163 below:
Figure 1163
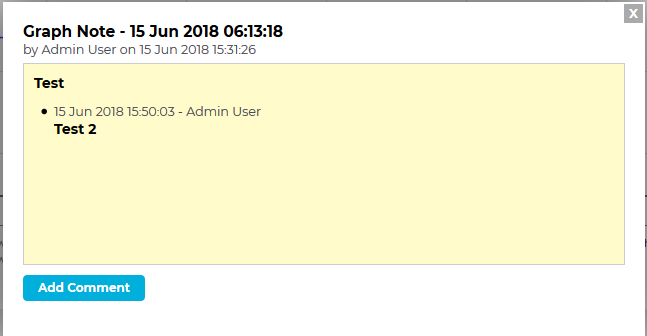
•Further comments can be added to the note by clicking on Add Comment again.
Current or Pulse Count Sensor Data
By default, a Current or Pulse Count Sensor's data is displayed as a Utilities Bar Chart in the Bar Chart [Sensor name].
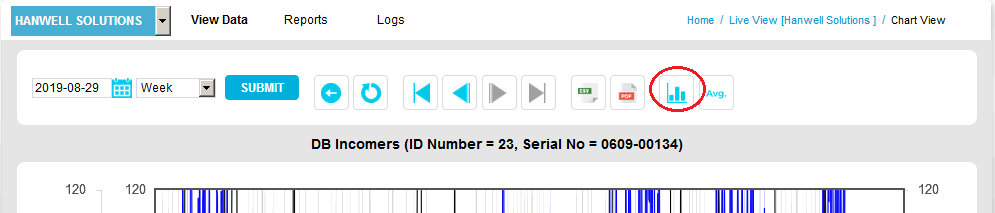
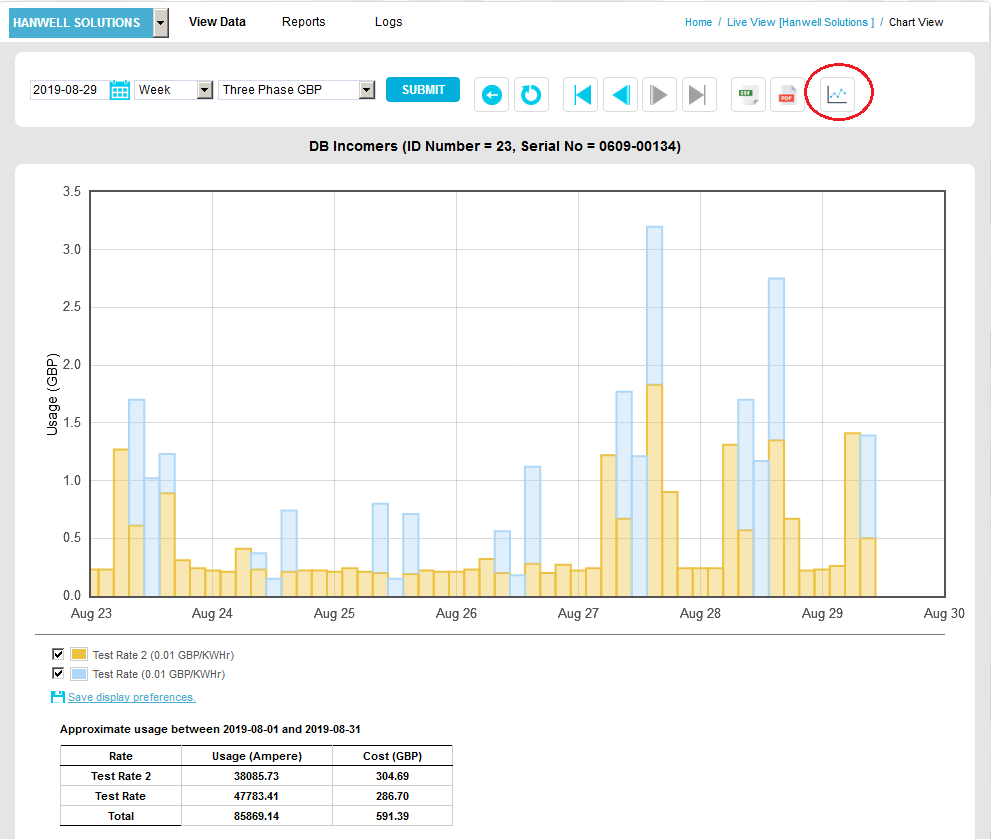
•To view a Current or Pulse Count Sensor's data as a Line Graph, click on the Line Graph button on top menu bar of the Bar Chart [Sensor name] window. See Figure 1164 below:
Figure 1164
•To return to the Utility Bar Chart view from the Line Chart view, click on the Bar Graph button on top menu bar of the Bar Chart [Sensor name] window. See Figure 1165 below:
Figure 1165