Navigation:
EMS Outputs > Viewing Sensor Data > Graphical Data >> Range/Level Alarms
Range/Level Alarms

Contents
The Range Alarms feature allows High Range Alarm and Low Range Alarm levels to be overlaid onto a line graph.
•Instructions relating to High and Low Range Alarms in this Section also apply, in their entirety, to High High and Low Low Range Alarms.
| Note: | To use this feature, Range Alarm levels will first need to be set. See the Alarms section for information on how to set alarms. |
•Overlaying Range Alarm Levels on a Graph
•Clearing Range Alarm Overlays from a Graph
Overlaying Range Alarm Levels on a Graph
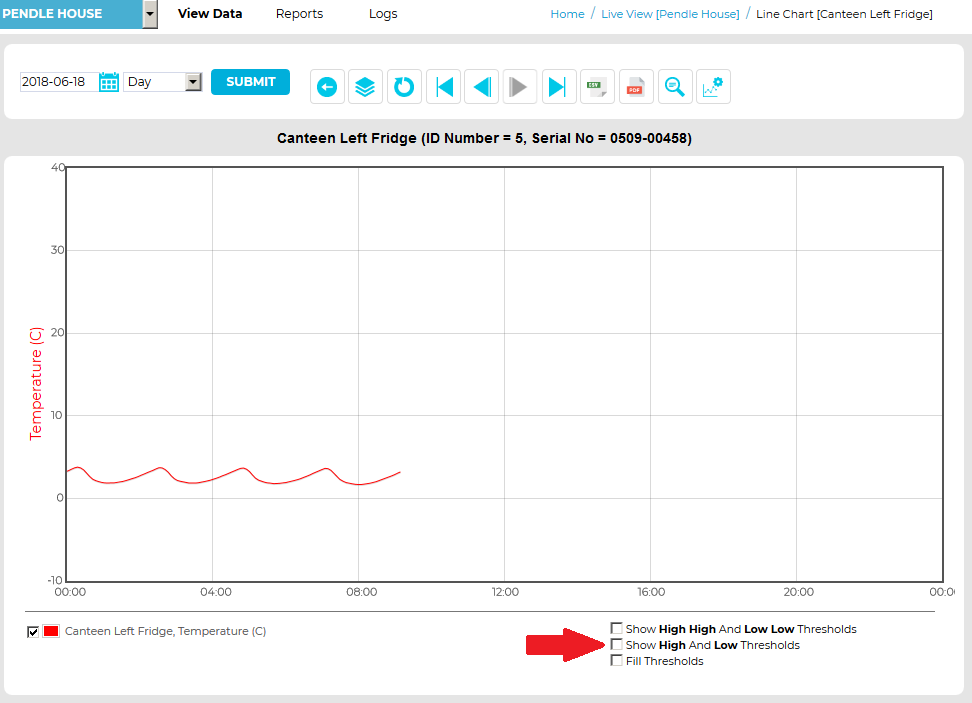
Check the Show High And Low Thresholds box on the bottom right-hand side of the Chart View window. See Figure 1144 below:
Figure 1144
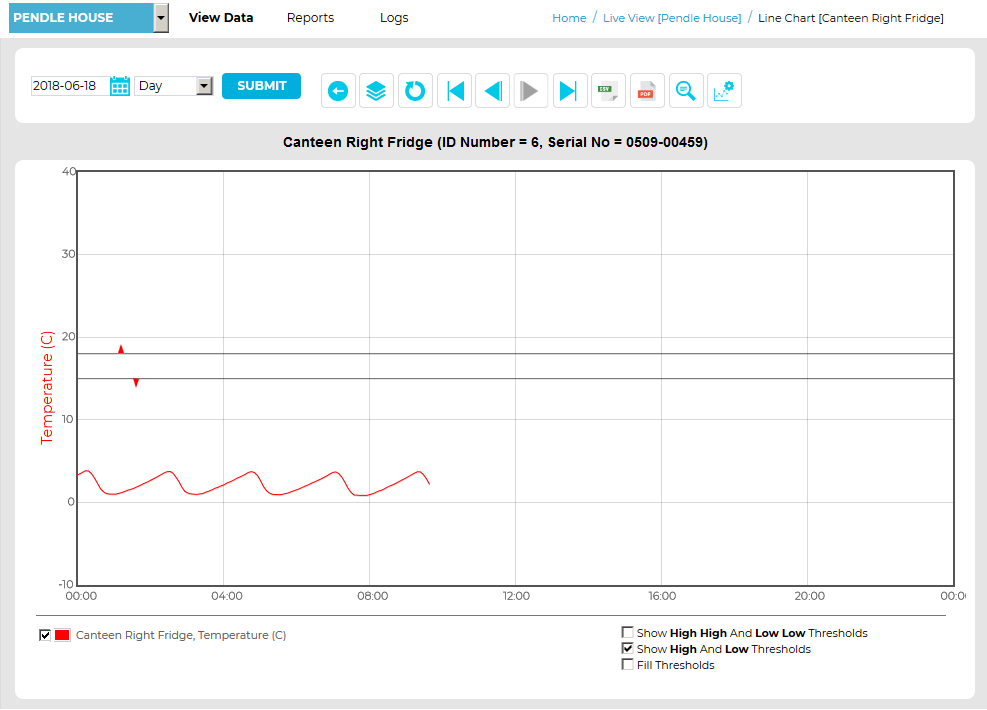
•The High Range Alarm and Low Range Alarm (if set from the Alarm Settings window) Thresholds are overlaid on the line graph, giving a clear visual indication of whether there has been an excursion either above or below the High and Low Range Alarm settings. See Figure 1145 below:
Figure 1145
➢For Multi-Channel Sensors, High Range Alarm and Low Range Alarm Thresholds for each data series are overlain on the line graph, if defined for the channel, giving a clear visual indication of whether there has been an excursion either above or below the Upper or Lower Range Alarm settings. See Figure 1146 below:
Figure 1146
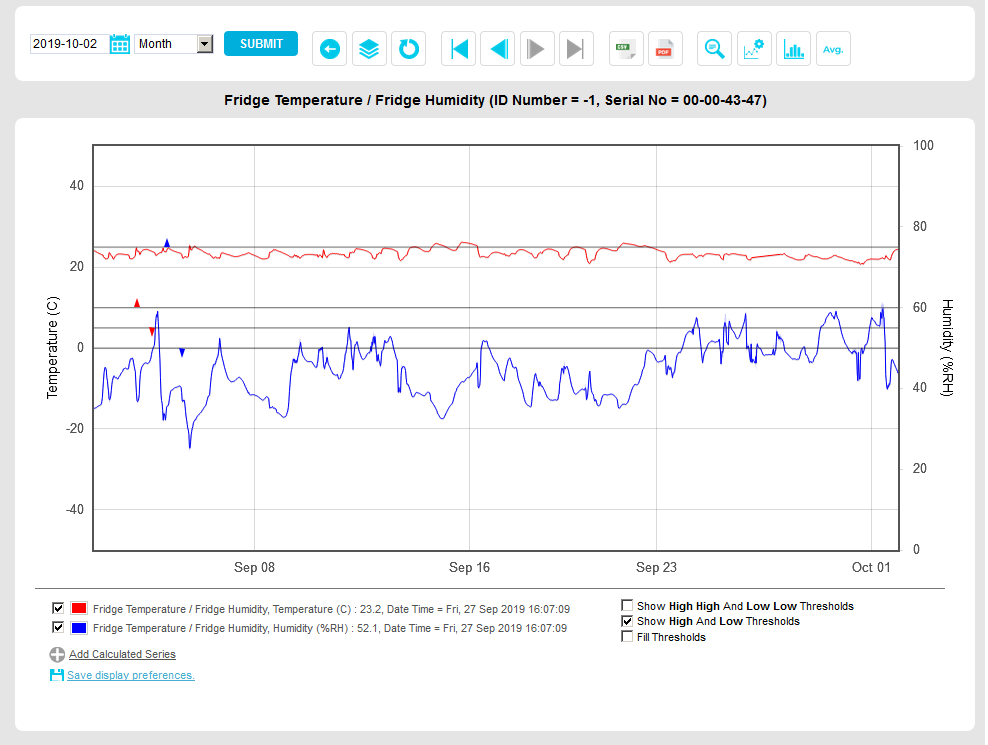
•The same procedure applies to overlaying High High and Low Low Thresholds.
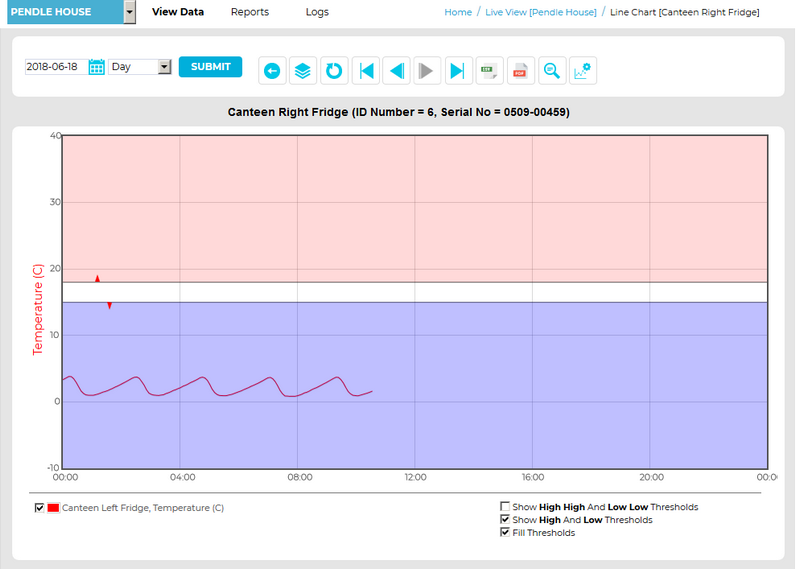
To highlight the areas of the graph outside either the High Range Alarm and Low Range Alarm values:
Check both the Show High And Low Thresholds and Fill Thresholds boxes on the bottom right-hand side of the Chart View window. See Figure 1147 below:
Figure 1147

•The Chart View window is displayed with the areas outside the High Range Alarm and Low Range Alarm values shaded in contrasting colours.colorSee Figure 1148 below:
Figure 1148
Clearing Range Alarm Overlays from a Graph
Uncheck the Show High And Low Thresholds box on the bottom right-hand side of the Chart View window. See Figure 1146 above.
•The Range Alarm overlays will be removed from the graph.