Navigation:
EMS Outputs > Alarm Management >> System Status and Alarm Overview
System Status and Alarm Overview

Contents
•User
When the User first logs onto EMS, the first screen displayed, the Graphical Overview or Dashboard, gives an overview of the System, including its Alarm Status.
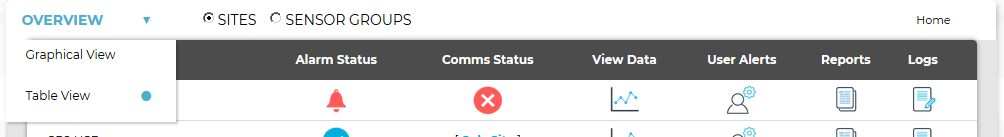
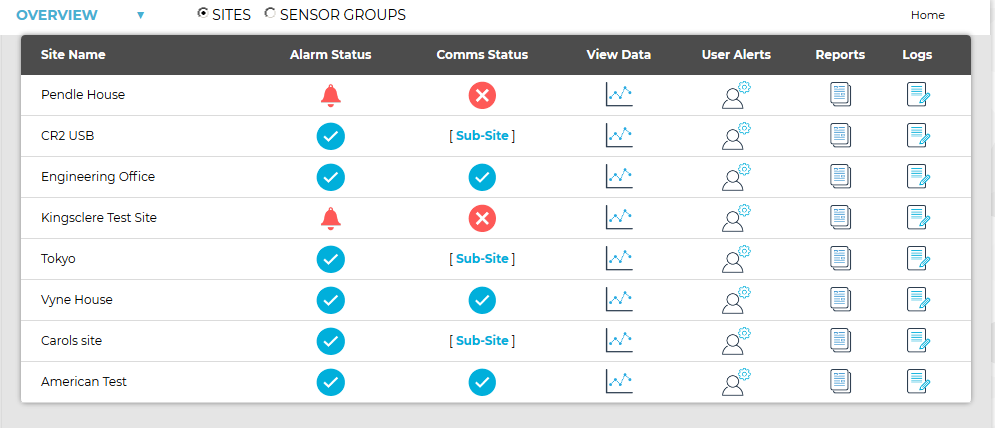
•To display the overview of the System as a table, select Table View from the Overview drop-down menu on the main window. See Figure 1212 below:
Figure 1212
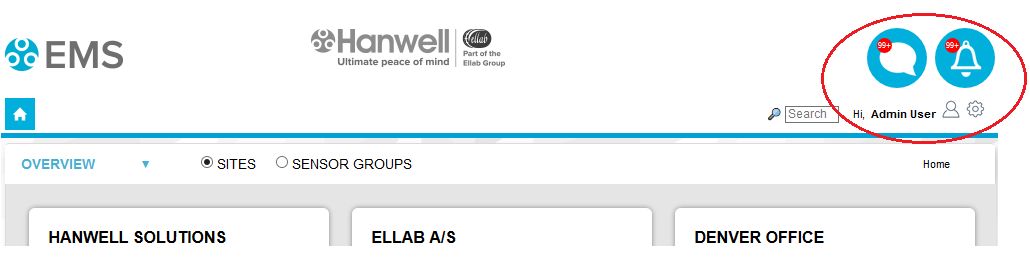
•System Status Information for the entire System is always displayed in the top right-hand corner of the Home screen. See Figure 1213 below:
Figure 1213
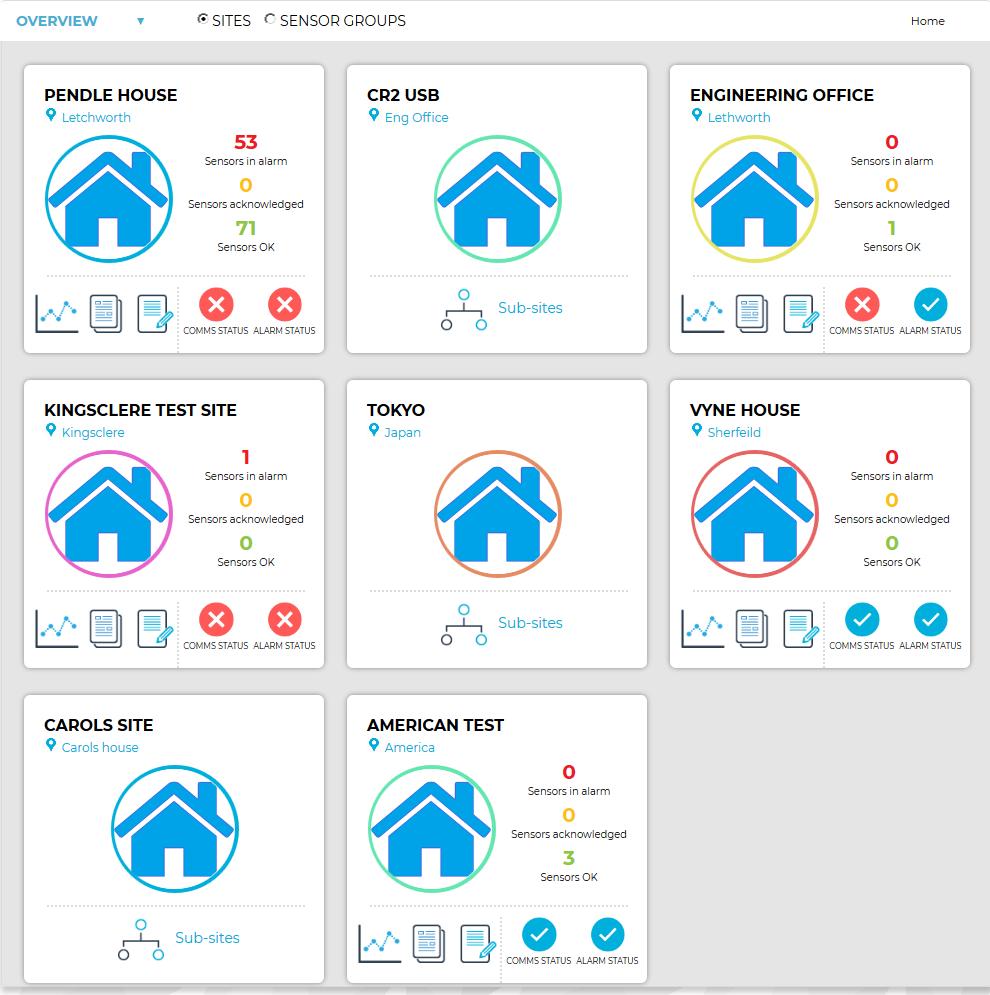
•Information on individual Sites can also be accessed via their Site Icons. See Figures 1214 below:
Figure 1214
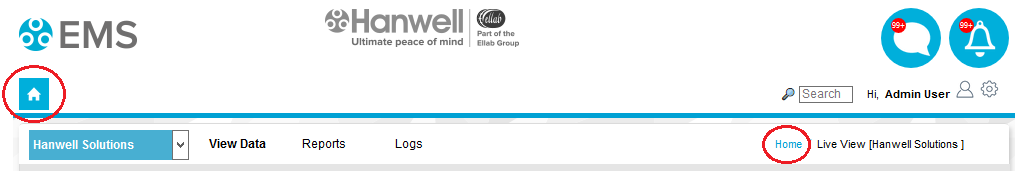
Once the User has navigated away from the Graphical Overview/Dashboard, the Site Icons can be accessed by clicking on either the Home icon on the top left of the screen or the Home link forming part of the current window's location address on the right-hand side of the screen. See Figure 1215 below:
Figure 1215
| Note: | The Home icon is always displayed at the top left-hand corner of the screen and the Home link and System Status Information are always displayed at the top right-hand corner of the screen regardless of where the User has navigated to in EMS. |
The following System Status information is always displayed in the top right-hand corner of the screen.
•User
•Alarm Status
•System Messages
See Figure 1216 below:
Figure 1216

The User currently logged in; Admin User in this example.
The Alarm Status of the entire System, can be viewed by clicking on the the Active Alarm icon. See Figure 1217 below.
Figure 1217

•The Active Alarm icon displays the number of unacknowledged alarms on the System as a number on the icon.
•Clicking on the Active Alarm icon displays an overview of the System in table form. See Figure 1218 below.
Figure 1218
•Clicking on a Site's red Alarm Status icon in the Alarm Status column displays the ALARM SENSORS [SITE NAME] window, showing a table listing the Site's unacknowledged Sensor Alarms. See Figure 1219 below.
Figure 1219
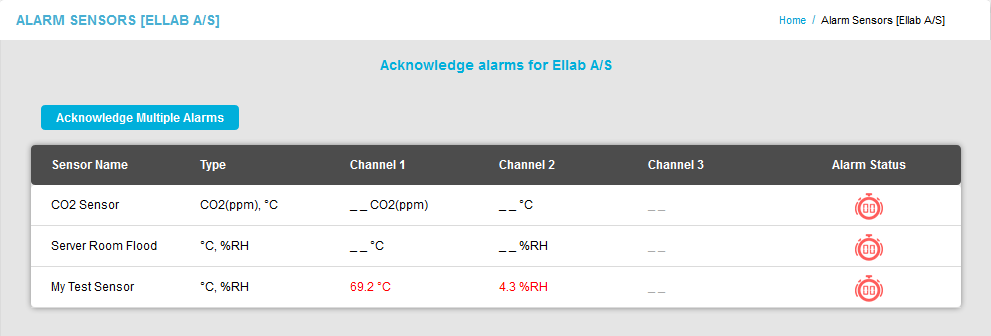
•A Sensor's entry in the Alarm Status column displays symbols representing all of its associated discrete Alarm Types that are currently in an Acknowledged or Unacknowledged state.
➢If more than one Alarm Type is associated with a Sensor, the display cycles though the Alarm Symbols for each discrete Alarm Type, displaying each, in turn, for 1 second.
The following Symbols are displayed to represent possible Alarm Types:
High Alarm |
|
High High Alarm |
|
Low Alarm |
|
Low Low Alarm |
|
|
|
Battery Alarm |
|
Digital Alarm - Closed |
|
Digital Alarm - Open |
|
Digital Input Alarm |
|
Rate of Change Alarm |
|
Door Alarm |
|


| Note: | The ALARM SENSORS [SITE NAME] window is not dynamic, i.e. it needs to be manually refreshed to show the latest Alarm State(s). Typically, this will occur if the User navigates away from the ALARM SENSORS [SITE NAME] window to Acknowledge/Reset an Alarm and then returns to the window. |
| Note: | New Alarms will only be triggered for a Sensor Channel or Channels if any previous alarms of the same type on the Channel or Channels have been Reset, following Acknowledgement: To Reset Individual Alarms To Reset Multiple Alarms However, data from the Sensor Channel or Channels still in an Alarm state can still be viewed in the normal way: Viewing Sensor Data for a Site Viewing Sensor Data for a Sensor Group |
System Messages can be viewed by clicking on the System Message icon. See Figure 1220 below.
Figure 1220

•The System Message icon displays the number of System Messages as a number on the icon.
•Both Email and SMS Notifications can be setup to send System Messages. For information on this, see Email System Group and SMS Systen Group.
•Clicking on the System Message icon to displays all of the System's System Messages. See Figure 1221 below.
Figure 1221
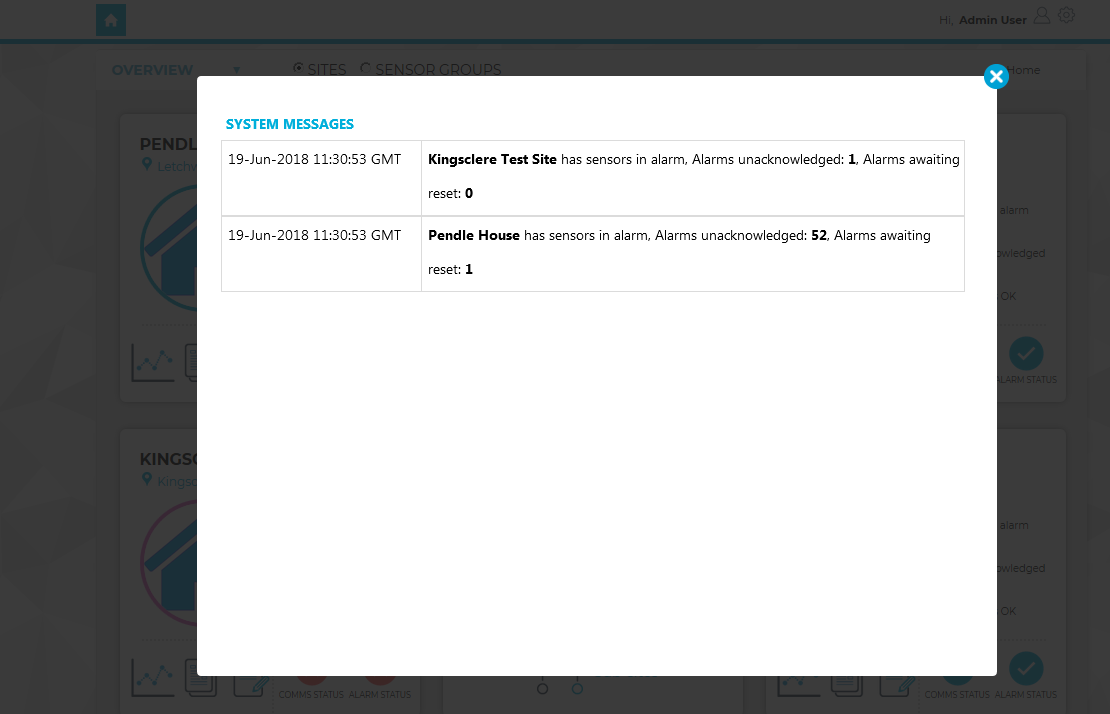
•The listed System Message(s) informs the User of where on the System the Alarm(s) is/are.
•Once this window is closed the circle showing the number of System Messages on the System Message icon changes to amber to indicate that the current live messages have been viewed, but there are no new ones since the last time the System Messages were checked. See Figure 1222 below:
Figure 1222

| Note: | Once a System Message has been read and is older than 24 hours, it will be removed from the list. |
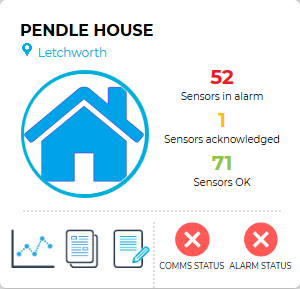
The individual Site Icons show the Alarm Status and Communications (Comms) Status for that specific Site. See Figures 1223 and 1224 below:
Figure 1223 |
Figure 1224 |
|
|

The Alarm Status symbols signify the following:
|
The Site has unacknowledged Alarms. Clicking on the symbol displays an overview of the System in table form, from where a listing of the Site's unacknowledged alarms can be accessed, as outlined in the Alarm Status section. |
|
The Site has no Sensors in Alarm. Clicking on the symbol displays the following window:
|


•The numbers of a Site's Sensors in Alarm, Sensors with acknowledged alarms and Sensors with no active alarms are listed on the icon.
The Communication (Comms) Status symbols signify the following:
|
The green icon indicates that communications to all Control Devices, such as SR2s, associated with the Site are operating normally. |
|
The red icon indicates that communications have been lost to one or more of the Site's Control Devices. In this instance, entries will be added to the Activity Log to be downloaded when communications are restored. |


Figure 1225
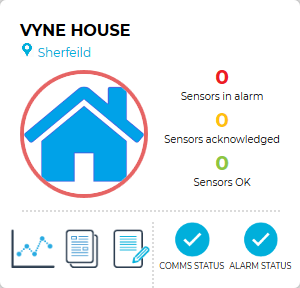
•In the above example we can see that we have no Sensors in Alarm, no Sensors acknowledged and 0 Sensors OK.
Control Device communications are operating normally.
Figure 1226
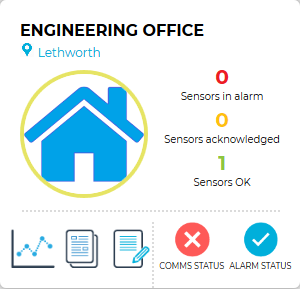
•In the above example we can see that we have 0 Sensors in Alarm, no Sensors acknowledged, and 1 Sensor OK.
Control Device communications are not operating normally.
Figure 1227
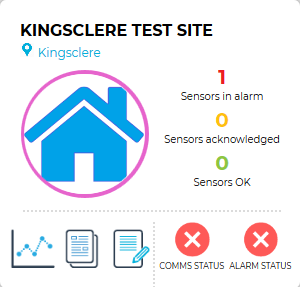
•In the above example we can see that we have 1 Sensors in Alarm, no Sensors acknowledged and 0 Sensors OK.
Control Device communications are not operating normally.
Notes: •Not all Sites on a System may have an icon displayed on the Graphical Overview/Dashboard. •Additionally, if the System has more than twelve Sites, not all Sites will be visible on the Dashboard. ➢There may, therefore, be a discrepancy between the Alarms unacknowledged and Alarms waiting reset figures displayed in the top right-hand corner of the dashboard (showing total figures for the entire System) and the totals of these figures shown on the individual Site Icons (showing figures for each displayed Site). ➢Similarly, it is possible that a message notification may be displayed (as a number) on System Message icon on the top right-hand corner of the dashboard, even though none of the displayed Sites appear to be in an Alarm State, if the Site in alarm has not been added to the Dashboard. |